New Relic Now Start training on Intelligent Observability February 25th.
Save your seat.
Pour le moment, cette page n'est disponible qu'en anglais.
 / 
MySQL

MySQL

Engage in MySQL performance monitoring with New Relic and benefit from improved performance, query optimization, and lower administrative overheads with our instant observability quickstart.

What's included?

dashboards
1
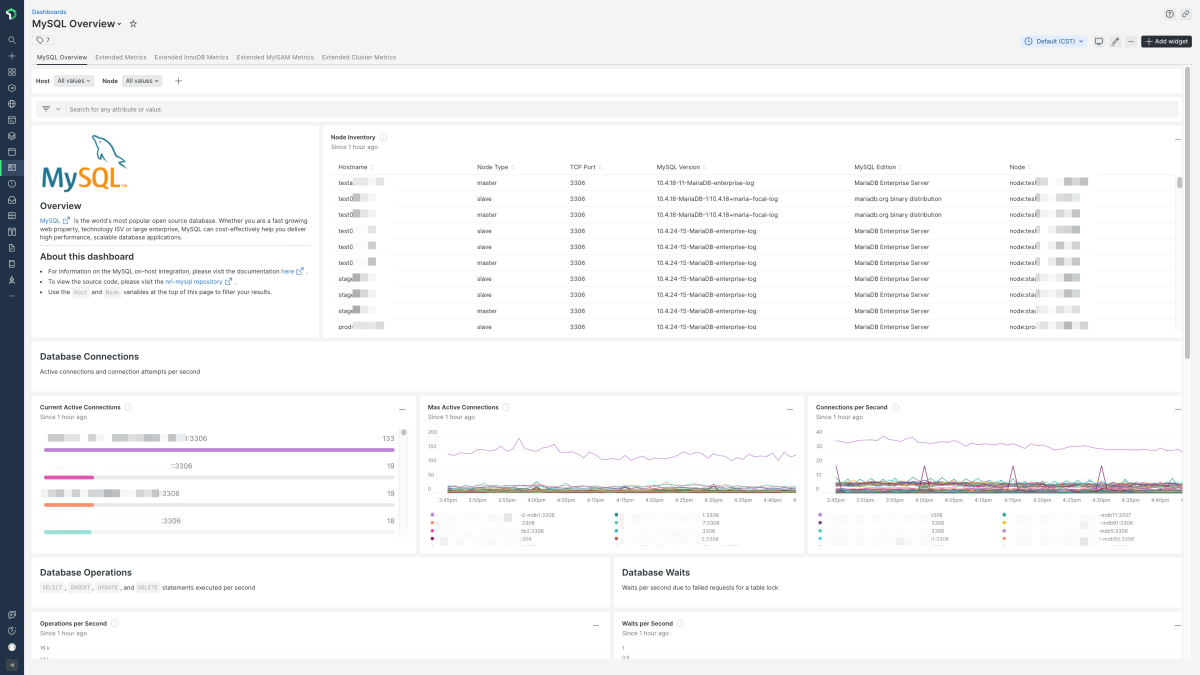
MySQL quickstart contains 1 dashboard. These interactive visualizations let you easily explore your data, understand context, and resolve problems faster.
alerts
4
MySQL observability quickstart contains 4 alerts. These alerts detect changes in key performance metrics. Integrate these alerts with your favorite tools (like Slack, PagerDuty, etc.) and New Relic will let you know when something needs your attention.
Slow Queries per Second
This alert is triggered when the number of slow queries per second is greater than 5 for 5 minutes, which could indicate capacity issues or a query that has been changed and is experiencing performance issues.
The Slow_queries counter increments based on your settings applied to MySQL's long_query_time parameter (default 10s), which you can review with this query:
SHOW VARIABLES LIKE 'long_query_time';
Max Connection Errors per Second
This alert is triggered when there are greater than 1 errors against the max_connections limit in a 5 minute window, which indicates you have requests to your MySQL instance that are failing to connect.
This setting's default is 501, but can vary based on the underlying resources available to your instance. You can review your current max_connections limit with this query:
SHOW VARIABLES LIKE 'max_connections';
Questions per Second
This alert is triggered when the current rate of Questions is greater than 2 standard deviations above the baseline for 60s, which could be an early indicator of a saturation problem for your instance.
It is important to note that this alert is disabled by default and you need to edit the configuration in New Relic One to add a targeted MySQL instance:
"WHERE displayName = 'MySql Instance Name'"
This allows the baseline to be calculated against a single instance instead of all running MySQL instances being monitored.
Innodb Pending Reads and Writes
This alert is triggered when the aggregate number of pending reads and writes in the MySQL buffer pool is greater than 2 for 5 minutes, which indicates the database engine is backlogged and waiting on resources.
documentation
1
MySQL observability quickstart contains 1 documentation reference. This is how you'll get your data into New Relic.

MySQL monitoring quickstart

Applications powered by relational database management systems demand the user to understand how the application uses it. Quickly identify and resolve the source server issues with MySQL performance monitoring tools.

Identify query optimization metrics and more within a single New Relic MySQL dashboard and ensure the highest application performance with this approach.

MySQL monitoring

Optimize your infrastructure by collecting inventory and metrics from your database. Analyze the data to ascertain server health and identify the source of potential problems.

New Relic + MySQL - your ideal tool for better monitoring

Install this quickstart to access pre-configured observability solutions. Unlike other performance monitoring tools, New Relic is a powerful proactive remote monitoring solution that provides a comprehensive view from a single MySQL dashboard.

What’s included?

The MySQL quickstart include out-of-the-box dashboards and alerts, including:

  • Alerts (pending reads and writes, max connection errors/second, questions/second, and slow queries/second)
  • Dashboards (operations/second, slow queries per minute by node, active connections by node, and more)

Value of MySQL quickstart

New Relic’s instant observability quickstart helps developers accelerate time to value. You can use this approach to help reduce administrative overheads. Implement this robust performance and infrastructure monitoring tool within minutes.

How to use this quickstart

  • Sign Up for a free New Relic account or Log In to your existing account.
  • Click the install button.
  • Install the quickstart to get started or improve how you monitor your environment. They're filled with pre-built resources like dashboards, instrumentation, and alerts.
Authors
New Relic
Zack Mutchler
Support
BUILT BY NEW RELIC
Need help? Visit our Support Center or check out our community forum, the Explorers Hub.