In today's complex and dynamic IT environments, maintaining reliable and efficient systems is crucial. Observability plays a key role in achieving this by providing insights into the internal states of systems through the collection, processing, and analysis of the system’s telemetry data.
Observability maturity refers to an organization's capability to understand and improve its systems' performance and reliability. There are three levels of observability maturity: basic, intermediate, and advanced. This blog post explores these levels and provides an example to illustrate each stage of maturity and adoption, including how New Relic can be leveraged at each level.
Level 1: Basic observability
At the basic monitoring level, observability focuses on essential metrics and simple alerting mechanisms. This stage is characterized by the collection of fundamental data points, such as CPU usage, memory consumption, and disk input/output (I/O). The primary goal is to ensure that the infrastructure is operational and to detect obvious issues like downtime, resource saturation, and availability. Basic monitoring provides a limited view of the system, often with no detailed insights into application-specific metrics or user experience.
Some of the highlights and limitations of basic monitoring include:
- Server uptime monitoring: Tracking whether servers are operational and available.
- Resource usage monitoring: Monitoring CPU, memory, and disk usage to identify resource constraints.
- Basic alerts: Setting up simple alerts to notify the operations team when critical thresholds are breached, such as high CPU usage or low memory.
- Reactive approach: Troubleshooting and issue resolution are mostly reactive, relying on alerts triggered by predefined thresholds. When issues arise, teams often scramble to collect data and diagnose the problem.
- Siloed tools: Monitoring tools are often disjointed and specific to particular components or teams. There is little to no integration between different monitoring solutions.
Example: Simple ecommerce store
Consider a basic ecommerce store running on a single server. At this level, the store's monitoring system might track:
- Server uptime: Ensuring the server is operational.
- CPU usage: Monitoring for high CPU usage that could indicate an overloaded server.
- Memory usage: Checking for memory leaks or insufficient memory.
- Disk I/O: Ensuring the disk isn’t being overutilized.
If the server goes down, an alert is triggered, notifying the team to investigate. However, the root cause of the problem may not be immediately clear, requiring manual intervention and diagnosis.
Solutions with New Relic
At the basic level, New Relic can help organizations establish foundational observability practices:
- Infrastructure monitoring: New Relic infrastructure monitoring provides insights into CPU, memory, disk I/O, and server uptime, ensuring that the fundamental aspects of the server are monitored and provide a centralized view of resource utilization, thus helping remove silos for your data.
- Alerting and notification: Configure basic alerts in New Relic to notify the team when key metrics exceed predefined thresholds, such as high CPU usage or low disk space.
- Dashboards: Pre-built and custom dashboards visualize essential metrics, providing an at-a-glance view of the system's health in real time.
By utilizing New Relic infrastructure monitoring, alerting, and custom dashboard capabilities, organizations at the basic level can improve their visibility into system health and centralize the process of identifying and resolving issues.
Infrastructure monitoring with basic alerts
Level 2: Enhanced observability
Enhanced observability expands on basic monitoring by incorporating more sophisticated metrics, logs, and traces. This level provides better visibility into application performance and user experience. It involves setting up custom dashboards, fine-tuned alerts, and beginning to implement distributed tracing. The focus shifts from purely infrastructure health to include application performance and user interactions. This stage allows teams to diagnose issues more effectively and understand the behavior of their applications in greater detail.
Key features of enhanced observability include:
-
Comprehensive metrics: Tracking key performance metrics such as response times, request rates, error rates, user interactions, and throughput for each application and service.
-
Log aggregation and analysis: Collecting and centralizing logs from various components to provide a comprehensive view of the system's state.
-
Distributed tracing: Implementing tracing to follow user requests as they move through different services and components, helping to identify bottlenecks and points of failure.
-
Fine-tuned alerting: Creating more detailed and targeted alerts based on specific application metrics and user interactions, allowing for more precise and actionable notifications.
Example
Consider the same ecommerce website. Now they’ve implemented a centralized logging solution, collecting detailed application metrics such as request latency, error rates, and user interactions with application performance monitoring (APM). When a user reports a slow checkout process, the team can use distributed tracing to follow the user's request through various microservices, identifying a bottleneck in the order processing service.
With enhanced observability, the ecommerce store can detect issues like slow database queries, increased error rates in the payments service, or latency in user authentication. Alerts can be more targeted, and dashboards provide real-time insights into the health of the application.
When a slowdown occurs, tracing shows that API calls to the payment gateway are taking longer than expected. The team quickly identifies the issue as a network latency problem with the third-party API. With detailed metrics and logs, they can correlate the issue with specific times and conditions, allowing them to contact the API provider with concrete data and work on a temporary solution while a permanent fix is being developed.
Solutions with New Relic
At the intermediate level, New Relic can enhance observability through more integrated and comprehensive capabilities:
- APM: Use New Relic APM to monitor detailed application performance metrics, including request rates, error rates, and response times. This helps identify and diagnose performance bottlenecks.
- Distributed tracing: Implement New Relic distributed tracing to track requests across microservices, providing visibility into the performance of each component involved in a transaction.
- Advanced alerts: Configure advanced alert policies that leverage a combination of metrics, logs, and traces to provide more precise and actionable alerts.
By leveraging New Relic APM, distributed tracing, and AI Ops capabilities, organizations at the intermediate level of their observability journeys can gain deeper insights into their applications, improve their ability to diagnose issues, and respond more effectively to performance problems.
Distributed Tracing visualized in Service Map with service healths
Level 3: Advanced observability
Advanced observability represents the highest level of maturity, where observability is deeply integrated into the development and release lifecycles. This stage includes predictive analytics, automated root cause analysis, and proactive issue resolution. Machine learning and AI capabilities can be employed to predict potential failures and optimize performance. The focus is on anticipating issues before they occur and automating the resolution process to minimize downtime and enhance user experience.
Key features of advanced observability include:
- Full-stack visibility: End-to-end visibility across the entire technology stack, from infrastructure to applications, including user behavior and external dependencies.
-
Predictive analytics: Leveraging machine learning to predict traffic patterns, potential failures, and performance degradation, allowing teams to take preemptive action. Utilizing AI to automatically analyze and identify the root cause of issues, significantly reduces the mean time to resolution (MTTR).
-
Comprehensive monitoring and insights: Combining data from multiple sources to provide a holistic view of system performance and health, enabling continuous improvement and optimization.
- Integration and collaboration: Seamless integration of observability tools with other IT operations tools, promoting collaboration across development, operations, and business teams.
Example
In the advanced stage, the ecommerce website employs a comprehensive all-in-one observability platform that provides full-stack visibility. This platform integrates with all aspects of the technology stack, including infrastructure, applications, user behavior, and third-party services. The platform uses AI to analyze telemetry data, automatically detecting anomalies such as unusual traffic patterns or performance degradation.
For instance, the observability platform detects an anomaly in user behavior indicating that users are abandoning their carts at a higher rate than usual. Upon investigation, it’s revealed that a recent deployment introduced a bug, causing slowdowns during the checkout process. The platform's AI capabilities correlate this behavior with increased response times in the payment service.
Before the issue significantly impacts revenue, the observability platform triggers automated alerts and can recommend remediation actions based on the deployment tracking changes. It also sends a detailed report to the development team, highlighting the root causes, stack traces, and in-context insights about the impacted entities. This proactive approach ensures a seamless user experience and minimizes the impact of issues on business operations.
Solutions with New Relic
At the advanced level, New Relic provides cutting-edge capabilities to achieve full-stack observability:
- Full-stack observability: Utilize New Relic full-stack observability to gain end-to-end visibility across infrastructure, applications, user behavior, and third-party services with platform features like logs in context, service maps, workloads, errors inbox and much more. This ensures comprehensive monitoring and correlation of telemetry data.
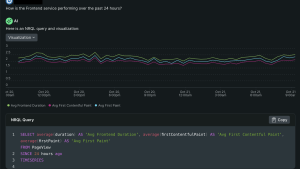
- AI-powered insights: Leverage New Relic AI—our generative AI observability assistant—for powerful insights to automatically detect anomalies, predict potential issues, and provide actionable recommendations. This enables proactive management of system health to reduce MTTR
- Proactive detection and automatic remediation: Proactively resolve issues with self-healing mechanisms with advanced integrations like webhooks, Amazon EventBridge, API gateways, and much more to automatically restart failed services or reroute traffic. This can help in reducing downtime and ensure consistent system performance.
APM 360 giving full-stack overview of the system
Conclusion
Understanding and implementing observability at various levels of maturity is crucial for maintaining robust, high-performing applications. From basic monitoring to advanced observability, each stage builds upon the previous one, providing increasingly sophisticated techniques to ensure system reliability and performance.
By employing New Relic full-stack observability, AI-powered insights, and advanced alerting integrations, organizations can achieve enhanced reliability, improved performance, and proactive remediation. This ensures high system performance, better collaboration across teams, and an optimal digital experience for their end users.
Next steps
- Measuring business success with observability metrics
- Learn more ways to reduce MTTR in Reducing MTTR the Right Way.
- Got lots of logs? Check out our tutorial on how to optimize and manage them
Don’t have New Relic? Sign up for free. Your account includes up to 100 GB/month of free data ingest, one full-platform user, and unlimited basic users.
The views expressed on this blog are those of the author and do not necessarily reflect the views of New Relic. Any solutions offered by the author are environment-specific and not part of the commercial solutions or support offered by New Relic. Please join us exclusively at the Explorers Hub (discuss.newrelic.com) for questions and support related to this blog post. This blog may contain links to content on third-party sites. By providing such links, New Relic does not adopt, guarantee, approve or endorse the information, views or products available on such sites.


