Large-scale distributed systems, constructed from multiple microservices, often have hidden dependencies. As Leslie Lamport famously said, "A distributed system is one in which the failure of a computer you didn’t even know existed can render your own computer unusable."
It’s invaluable to have distributed tracing, which allows you to follow a single request as it moves across service boundaries. With distributed tracing, you can discover the latency within a request and identify bottlenecks and failures. Along with events, logs, and metrics, distributed traces are one of the four essential data types of observability.
OpenTelemetry is an open source telemetry framework created through the merger of OpenTracing and OpenCensus. Aiming to be robust, portable, and easy to implement across many languages, it provides a single set of APIs, libraries, agents, and collector services to capture distributed traces and metrics from your applications. It’s also backward compatible with OpenTracing and OpenCensus, meaning that you can migrate from either of those projects to OpenTelemetry without any breaking changes.
Diving into the OpenTelemetry project’s beta release
At the end of March, the OpenTelemetry team announced the first beta release, and as collaborators on the OpenTelemetry project, we’re excited to announce support for OpenTelemetry in New Relic. Given that it remains in beta, it is not yet suitable for production use, but you should explore the capabilities that OpenTelemetry provides.
The first beta release includes a specification and SDKs to instrument applications written in Erlang, Go, Java, JavaScript, and Python. Each SDK released by OpenTelemetry contains examples of common use cases to help you get started. These examples provide working code that illustrates how to instrument HTTP/gRPC servers and clients, database connectors, and more.
In OpenTelemetry: Future-Proofing Your Instrumentation, we explain more about the OpenTelemetry project—how it works, the benefits it offers—and describe the various architecture components that make up the project, including the OpenTelemetry API, the OpenTelemetry SDK, and the Collector. You can configure the Collector to export to a variety of open source formats (Jaeger, Zipkin, and OpenCensus) and observability tools, such as New Relic One.
In this post, we’ll show how to manually and automatically instrument a Java application with OpenTelemetry, and send the generated data to New Relic.

Note: To run these examples, sign up for a free New Relic account. You’ll need an Insert API key.
Example 1: Manual instrumentation of a Java application with OpenTelemetry
If you have very quick, repeatable services, building custom manual instrumentation may not be necessary, but for longer running services and more complex systems, it might be appropriate. OpenTelemetry offers a tracer to enable custom instrumentation throughout your application, and it’s straightforward to use.
In this simple example, you’ll see how to create a tracer, add a root and two child spans with some attributes, and export that data to New Relic. This example uses Maven to build the dependencies, but you can also use Gradle. Note that the OpenTelemetry APIs are still under active development and will likely change in future versions.
To get started, add your Insert API key to String apiKey in the following code.
Note: If you connect to New Relic in the EU, you’ll also need to uncomment the URI override setting (.uriOverride) and set the appropriate EU API endpoint.
package com.conissaunce.otelnrexample;


import static

io.opentelemetry.sdk.resources.ResourceConstants.SERVICE_NAME;

import com.newrelic.telemetry.Attributes;

import com.newrelic.telemetry.opentelemetry.export.NewRelicSpanExporter;

import io.opentelemetry.OpenTelemetry;

import io.opentelemetry.context.Scope;

import io.opentelemetry.sdk.OpenTelemetrySdk;

import io.opentelemetry.sdk.trace.export.BatchSpanProcessor;

import io.opentelemetry.trace.Span;

import io.opentelemetry.trace.Status;

import io.opentelemetry.trace.Tracer;

import java.net.URI;

import java.util.logging.Logger;


public class MyApp {


   private static final Logger logger = Logger.getLogger(MyApp.class.getName());


   public static void main(String[] args) {


      //Configure the New Relic SDK.

      String apiKey ="Put Your API key here!";


     //Create a NewRelicSpanExporter for the EU data center - you can leave out the uriOverride if you are in the US

     NewRelicSpanExporter exporter =

NewRelicSpanExporter.newBuilder()

                        .apiKey(apiKey)


//.uriOverride(URI.create("https://trace-api.eu.newrelic.com/"))

               .commonAttributes(new Attributes().put(SERVICE_NAME, "OpenTelemetry example")).build();


     //Build the OpenTelemetry BatchSpansProcessor with the NewRelicSpanExporter

     BatchSpanProcessor spanProcessor = BatchSpanProcessor.newBuilder(exporter).build();


     //Add the rootSpan processor to the default TracerSdkProvider


penTelemetrySdk.getTracerProvider().addSpanProcessor(spanProcessor);


     //Create an OpenTelemetry Tracer


      Tracer tracer = OpenTelemetry.getTracerProvider().get("opentel-example", "1.0");


     //Create a basic rootSpan.  You only need to specify the name of the rootSpan. The start and end time of the


     // rootSpan is automatically set by the OpenTelemetry SDK.

     Span rootSpan = tracer.spanBuilder("getCustomerOrder").startSpan();


     //Key:value pairs can be used to affix metadata to spans, events, metrics, and distributed contexts in order to

    // query, filter, and  analyze trace data.  Add a simple attribute to our rootSpan.

    rootSpan.setAttribute("Root-span-attribute", 1);


    try (Scope scope = tracer.withSpan(rootSpan)) {


        //Just pause to pretend we're doing something

        Thread.sleep(300);


       //Add a couple of child spans to the root span

       Span childSpan = tracer.spanBuilder("getCustomerRecord").startSpan();


       logger.info("Active Span: " + tracer.getCurrentSpan().toString());

       Thread.sleep(500);

       childSpan.end();


       Span childSpan2 = tracer.spanBuilder("getOrderDetails").startSpan();

       childSpan2.setAttribute("customer-id", 1);

       childSpan2.setAttribute("order-no", 100);


       Thread.sleep(1500);

       childSpan2.end();


       Thread.sleep(1000);


    } catch (Throwable t) {

        Status status = Status.UNKNOWN.withDescription("Cunning error message goes here!");

        rootSpan.setStatus(status);

     } finally {

         rootSpan.end(); // closing the scope does not end the rootSpan, this has to be done manually

         spanProcessor.shutdown();

     }

  }

}
Next, add the Maven dependencies.
<dependency>

   <groupId>io.opentelemetry</groupId>

   <artifactId>opentelemetry-api</artifactId>

   <version>0.5.0</version>

</dependency>

<dependency>

   <groupId>io.opentelemetry</groupId>

   <artifactId>opentelemetry-sdk</artifactId>

   <version>0.5.0</version>

</dependency>

<dependency>

   <groupId>com.newrelic.telemetry</groupId>

   <artifactId>telemetry</artifactId>

   <version>0.6.0</version>

</dependency>

<dependency>

   <groupId>com.newrelic.telemetry</groupId>

   <artifactId>opentelemetry-exporters-newrelic</artifactId>

   <version>0.5.0</version>

</dependency>
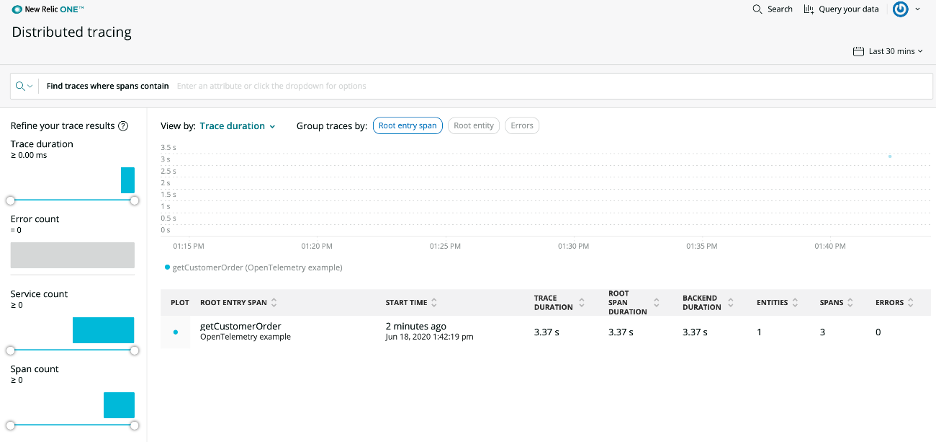
Finally, run your application. To find your spans, go to New Relic One and select Distributed tracing from the home page.

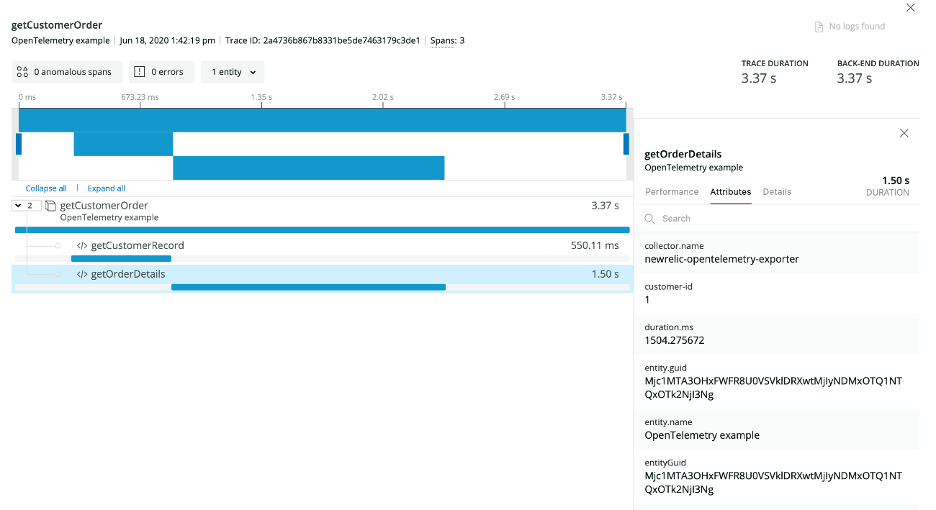
Click on the root span labeled getCustomerOrder, and you'll see an expanded view, which allows you to see the child spans and other contextual data.

Example 2: Auto instrumentation of a Java application with OpenTelemetry
In addition to manual instrumentation, the OpenTelemetry project includes a Java agent JAR that you can add to any application running Java version 7 or higher. The agent will dynamically inject bytecode to capture telemetry from a number of popular libraries and frameworks, allowing you to gather telemetry data without having to instrument your application manually—or make any code changes.
While the granularity is less than you would get from manually instrumenting your own code, it provides a good starting point, and overcomes the issue of instrumenting third-party libraries manually. Moreover, although the OpenTelemetry project is new, the range of supported libraries is extensive, as it’s been built on top of the existing work done for OpenCensus and OpenTracing.
OpenTelemetry includes a simple logging exporter, and you can view its output in your terminal to verify that spans are being created. As such, it is immensely helpful for debugging.
To try this out:
- Download the latest release of the logging exporter.
- Find a suitable app; you can use your own app or grab something like the Spring Pet Clinic.
- Start the application and add the agent JAR:
java -javaagent:path/to/opentelemetry-auto-all.jar \


-Dota.exporter=logging


-jar target/*.jar
You should see telemetry logging information appearing in the terminal:
If you scan your terminal, you can see version information:
[opentelemetry.auto.trace 2020-06-16 10:15:48:157 +0100] [main] INFO io.opentelemetry.auto.tooling.TracerInstaller - Installed span exporter: io.opentelemetry.auto.exporters.logging.LoggingExporter

[opentelemetry.auto.trace 2020-06-16 10:15:48:160 +0100] [main] INFO io.opentelemetry.auto.tooling.VersionLogger - opentelemetry-auto - version: 0.3.0~f4fde658d
You can also see a number of spans being created as the Spring Pet Clinic app starts doing database work. For example:
span.origin.type="com.zaxxer.hikari.pool.HikariProxyStatement" db.url="h2:mem:" Logging Exporter
Sending the auto instrumentation to New Relic
To send this data to New Relic, grab the New Relic OpenTelemetry Java exporter.
You can build it using ./gradlew build
Now, from the command line, run the following using your Insert API Key.
java -javaagent:path/to/opentelemetry-auto-<version>.jar \


-Dota.exporter.jar=path/to/opentelemetry-exporter-newrelic-auto-<version>.jar \


-Dota.exporter.newrelic.api.key=INSERT_API_KEY \


-Dota.exporter.newrelic.service.name=your-service-name \


-Dota.exporter.newrelic.uri.override=https://trace-api.eu.newrelic.com/ \


-jar myapp.jar
Note: Again, if your New Relic account is in the EU, you’ll need to include the manual URI override. Otherwise you can leave that argument out.
Starting with auto-instrumentation release 0.7.0, the -Dota option has been updated to -Dotel:
java -javaagent:path/to/opentelemetry-auto-<version>.jar \


-Dotel.exporter.jar=path/to/opentelemetry-exporter-newrelic-auto-<version>.jar \


-Dotel.exporter.newrelic.api.key=INSERT_API_KEY \


-Dotel.exporter.newrelic.service.name=your-service-name \


-Dotel.exporter.newrelic.uri.override=https://trace-api.eu.newrelic.com/ \


-jar myapp.jar
If you encounter an issue with this, turn on debug logging for the exporter running in the auto-instrumentation agent, using the following system property:
-Dio.opentelemetry.auto.slf4j.simpleLogger.log.com.newrelic.telemetry=debug
And, if you want to enable audit logging for the exporter running in the auto-instrumentation agent, use this system property:
-Dota.exporter.newrelic.enable.audit.logging=true
With auto-instrumentation release 0.7.0:
-Dotel.exporter.newrelic.enable.audit.logging=true
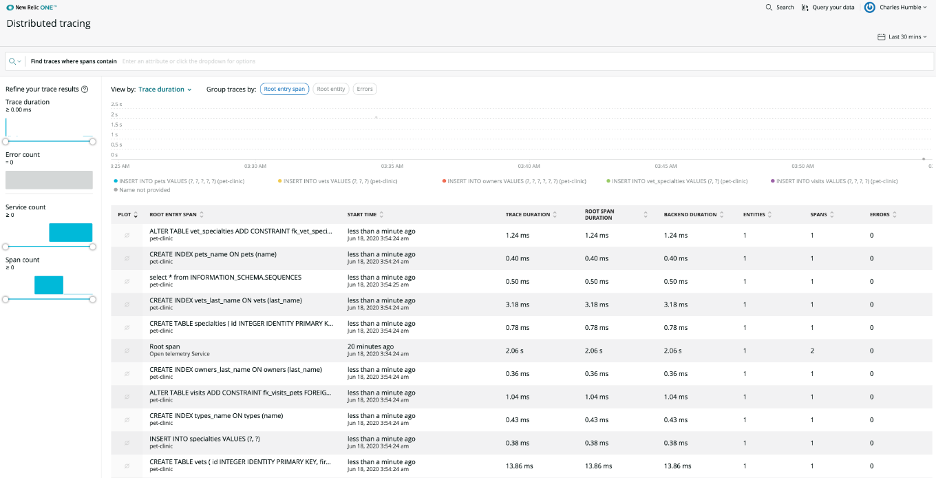
To find your spans, go to https://one.newrelic.com/ and select Distributed tracing from the home page.

Next steps
To learn more, check out the OpenTelemetry quick-start guide for Java—it provides full, detailed examples for working with the tracer.
The New Relic open-telemetry-exporter-java project has a file, BasicExample.java, which provides more example code for how to set up custom telemetry for an application and send it to New Relic. That example includes topics we’ve not covered here, including metrics instrumentation.
The GitHub project also provides a written tutorial.
A version of this post previously ran on The New Stack.
Next steps
To find out more about New Relic’s contributions to OpenTelemetry and other open source projects New Relic is involved in, visit New Relic Open Source.
To get started with OpenTelemetry and New Relic, sign up for a free New Relic account.

The views expressed on this blog are those of the author and do not necessarily reflect the views of New Relic. Any solutions offered by the author are environment-specific and not part of the commercial solutions or support offered by New Relic. Please join us exclusively at the Explorers Hub (discuss.newrelic.com) for questions and support related to this blog post. This blog may contain links to content on third-party sites. By providing such links, New Relic does not adopt, guarantee, approve or endorse the information, views or products available on such sites.


