Today’s software is orders of magnitude more complex than software of 20+ years ago, which has brought new challenges when it comes to troubleshooting our code. Fortunately, we’ve come pretty far in understanding how our applications are performing and where issues are occurring by implementing observability into our systems.
However, it’s not just software that has evolved—the process of creating and developing it has also changed. DevOps introduced the concept of CI/CD. With delivery cycles shortening from monthly to quarterly to now weekly or even multiple times a day, we’re embracing automation across the software delivery pipeline.
Unfortunately, observability for CI/CD pipelines has not progressed much compared to application software. Considering these pipelines are the backbone of the software delivery process, it’s surprising: If you don’t have visibility, then how do you troubleshoot issues when something goes wrong and you can’t get software into production?
That’s what we’ll focus on in this blog: observability of CI/CD pipelines. First, we’ll define a few things; then, we’ll dive into why being able to observe pipelines matters and how to make them observable; finally, we’ll wrap up by talking about some of the remaining challenges.
Key concepts
Here are some definitions to know:
Observability
There are multiple definitions of observability, so we’ll narrow it down to our favorite:
Observability, or o11y (pronounced “ollie”), lets you understand a system from the outside by letting you ask questions without knowing the inner workings of that system.
This means that even though you don’t understand all the nitty-gritty underlying business logic of a system, the system emits enough information for you to follow the breadcrumbs to answer: “Why is this happening?” However, you can’t have observability if your system doesn’t emit information. How do you get that information? One way is with OpenTelemetry.
Fun fact: The 11 in “o11y” represents the number of characters between the “o” and the “y” in the word “observability.”
OpenTelemetry
OpenTelemetry (OTel), is an open source observability framework for generating, collecting, transforming and exporting telemetry data. It provides a set of APIs, software development kits (SDKs), instrumentation libraries, and tools to help you accomplish this. Since its official inception in 2019, it has become the de facto standard for application instrumentation and telemetry generation and collection, used by companies including eBay and Skyscanner.
One of its biggest benefits is freedom from vendor lock-in. You can instrument your applications once and send your telemetry to whichever backend works best for you. It also provides some pretty cool tools, such as the Collector.
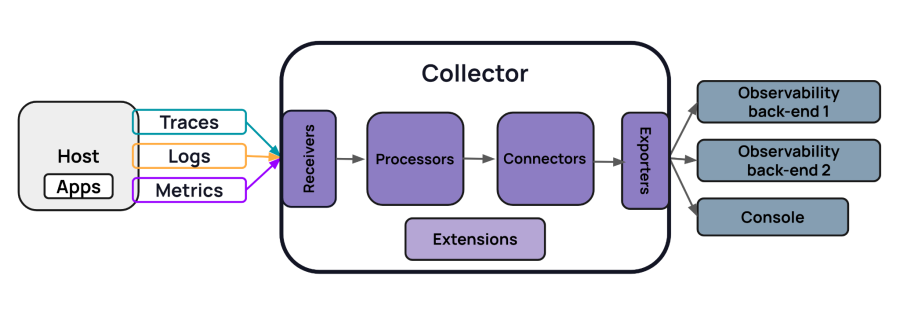
The Collector is a vendor-neutral service used to ingest, transform and export data to one or more observability backends. The Collector consists of four main components that access telemetry:

- Receivers ingest data, whether it’s from your application code or your infrastructure.
- Processors transform your data. A processor can do things like obfuscate your data, add attributes, remove attributes, or filter data.
- Exporters convert your data into a format that’s compatible with your chosen observability backend.
- Connectors allow you to connect two pipelines.
You can think of the OTel Collector as a data pipeline.
CI/CD pipelines
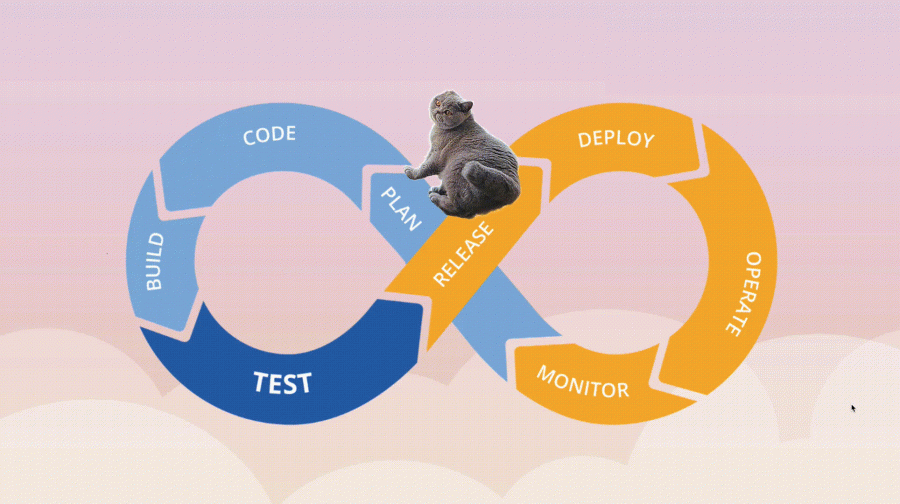
CI/CD is an automated approach to software delivery that draws on two key practices:
- Continuous integration (CI), which is about building, packaging, and testing your software whenever a code change is made.
- Continuous delivery (CD), which is about taking that software package and deploying it to production right away.

Automated pipelines enable fast product iterations by allowing you to get any new features, bug fixes, and general updates out to your customers faster. It removes the risk of manual errors, and it standardizes the feedback loop to your developers.
Why CI/CD pipeline observability matters
When your pipeline is healthy, your team can write, build, test, and deploy code and configuration changes into production continuously. You can also improve or achieve development agility, which means you can change your operations and minimize the time it takes to figure out whether those modifications had a positive or negative impact on your application’s health.
Conversely, when your pipeline is unhealthy, you may run into one or more of the following problems:
- Slow deployments: Bug fixes may not get out fast enough to curb user dissatisfaction, and issues may become critical.
- Testing issues: Having to wait for tests to complete, or not having enough time to test against different configurations, may result in delayed deployments and difficulty achieving sufficient application performance across your user base.
- Technical debt: Difficulty in determining underlying issues can cause technical debt.
Pipelines are the production systems of DevOps engineers
Although pipelines may not be a production environment external users interact with, they’re most certainly a production environment that internal users—for example, software engineers and site reliability engineers (SREs)—interact with. Being able to observe your prod environment means:
- Preventing unnecessarily long cycle times, or lead time for changes, which impacts the amount of time it takes a commit to get into production.
- Reducing any delay in pushing out new features and bug fixes.
- Reducing wait time for users.
Code can fail
CI/CD pipelines are run by code that defines how they work, and despite your best and most careful efforts, code can still fail. Making application code observable helps you make sense of things when you run into production issues. Similarly, having visibility into your pipelines can help you understand what’s going on when they fail.
Troubleshooting is easier
Having observable pipelines helps answer questions such as:
- What failed?
- Why did it fail?
- Has this failed before?
- What has failed most frequently?
- What’s the normal runtime of the pipeline?
- Are there any bottlenecks? If so, what are they?
- Can you shorten the lead time for fixing pipeline issues?
What kind of data do you want to collect?
To answer these questions, you need to collect information about your pipelines. But what should that information be? Capture things like:
- Branch name
- Commit secure hash algorithm (SHA)
- Machine IP
- Run type (scheduled, triggered by merge/push)
- Failed step
- Step duration
- Build number
How to observe pipelines
Recall that a system is observable when it emits enough information to answer the question, “Why is this happening?” First, you need a means to emit that information; then, you need a place to send it to; and finally, you need to analyze it and figure out what you need to fix.
This is where OpenTelemetry comes in. You can implement OpenTelemetry in your systems to emit the information you need to achieve observability of your systems. And like you use it for applications, you can also use it for CI/CD pipelines. You still need to send the generated telemetry to a backend such as New Relic for analysis.
Using OpenTelemetry
OpenTelemetry makes a lot of sense for instrumenting CI/CD pipelines because many people already instrument applications with it; adoption and implementation has steadily increased in the last couple years.
Using New Relic
You have these options when it comes to monitoring CI/CD pipelines with New Relic:
Forward CircleCI logs to New Relic
You can configure the CircleCI webhook service to send CI/CD logs to New Relic.
GitHub Actions Exporter
You can use this exporter to monitor your GitHub Actions, which makes it easier to obtain observability into the health and performance of your CI/CD workflows. It pulls logs from your GitHub Action steps, and then adds trace and span IDs to correlate them with traces.
Here’s what you can do with the exporter:
- Visualize key metrics on your GitHub Actions, such as how long your workflow/jobs/steps are taking, and how often they are failing.
- Visualize workflows/jobs and steps as distributed traces with logs in context, reported to an OpenTelemetry service entity with New Relic.
- Pinpoint the origin of issues in your workflows.
- Create alerts on your workflows.
Please note that this tool was developed by our field team, and is housed in our Experimental repo. This means that the code is not necessarily used in production, but is being developed in the open—which also means your contributions are welcome.
Change tracking with New Relic
New Relic also offers a change tracking feature that allows you to monitor the effect of changes on your customers and systems. You designate which changes to monitor, and then check the results in your New Relic account. This enables you to track any changes you make in your environment during your release pipeline.
You can use this feature with GitHub Actions (example here) and also using Jenkins (tutorial here), and then learn how to view and analyze your changes in the UI.
What are some other options?
Currently, this is a bit of a mixed bag. There are:
- Commercial SaaS monitoring solutions.
- Vendor-created tools you can plug into existing CI/CD tools to help achieve CI/CD observability (for example, Honeycomb buildevents).
- Homegrown GitHub actions (see examples here, here, and here) to enable observability in CI/CD pipelines.
- Homegrown CircleCI webhook for OTel.
- Homegrown Drone CI webhook for OTel.
- Native OpenTelemetry integration into Jenkins and Tekton.
You can also integrate these tools into your CI/CD pipelines; they emit OpenTelemetry signals, thereby helping make your pipelines observable:
- Maven build OTel extension emits distributed traces of Java builds.
- Ansible OpenTelemetry callback traces Ansible playbooks.
- Dynatrace’s JUnit Jupiter OpenTelemetry Extension is a Gradle plug-in for gathering data of JUnit test executions via OpenTelemetry. There’s also a Maven version.
- pytest-otel records distributed traces of executed Python tests.
- otel-cli is a command line interface (CLI) tool written in Go that enables shell scripts to emit traces.
- Filelog receiver (OTel Collector) tails and parses logs from files.
- Git Provider receiver (OTel Collector) scrapes data from Git vendors.
Observable pipeline example
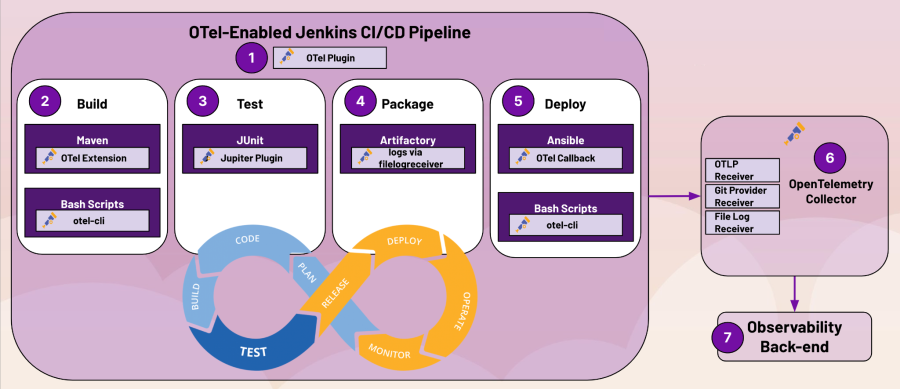
This diagram shows how to gain pipeline observability with some of the tools mentioned above. Suppose you’re building and deploying a Java application. You’re using Jenkins to orchestrate build and deployment:

- The Jenkins CI/CD pipeline can emit telemetry signals via the Jenkins OTel plug-in.
- In the build stage:
- You can use the Maven OTel extension to emit distributed traces of Java builds.
- If your build includes shell scripts, you can use the otel-cli tool to enable your shell scripts to emit traces.
- In the test stage, the JUnit Jupiter plug-in for Maven allows you to gather data of JUnit test executions via OpenTelemetry.
- In the packaging stage, using Artifactory to package your application, you can send its logs to the OTel Collector via the Filelog receiver, which tails and parses logs from files.
- In the deployment stage using Ansible to orchestrate your deployments, the Ansible OpenTelemetry callback adds traces to your Ansible playbooks. If your Ansible playbook also uses shell scripts, it can take advantage of the otel-cli tool, allowing your shell scripts to emit additional trace data.
- The signals emitted by the various plug-ins are ingested by an OTel Collector. The data can be ingested using the standard OTLP receiver to ingest telemetry data, and the Git Provider receiver and Filelog receiver. The telemetry signals are then sent by the Collector to an observability backend.
- Once your data has arrived at your observability backend, you can view and query your data, set alerts and more.
Challenges with achieving observable pipelines
While it makes sense to use OpenTelemetry to enable CI/CD pipeline observability, there’s a lack of standardization, and the tooling landscape is disorganized.
OpenTelemetry isn’t built into most CI/CD tooling. And while there’s a desire to add observability capabilities to CI/CD tools like GitLab and GitHub Actions, these initiatives have been slow-moving. For example, while there has been activity on the GitLab request for pipeline observability with OTel, that item has been open for two years. The OTel proposal for observability of CI/CD pipelines was opened in January 2023, but (as of November 2023), there hasn’t been activity since July 2023.
Therefore, you’re at the mercy of individuals and organizations who create their own thing if you want to use that tooling. What happens if they decide not to maintain these tools anymore?
Learn more
Making your CI/CD pipelines observable helps you troubleshoot them more effectively, achieve development agility, and gain insights into their inner workings so that you can tweak them to help them run more efficiently.
A healthy pipeline means you can write, build, test, and deploy new code continuously. Conversely, an unhealthy pipeline can mean slower deployments, testing issues, and technical debt.
You can use OpenTelemetry to add observability into your pipeline. Although options are limited at this time, things are moving in the right direction, and we’re excited for what the future of CI/CD holds.
Further reading:
- Leveraging OpenTelemetry to Enhance Ansible with Jaeger Tracing
- Check out the cicd-o11y channel on CNCF Slack
You can also try:
A version of this blog post was originally published on The New Stack.
The views expressed on this blog are those of the author and do not necessarily reflect the views of New Relic. Any solutions offered by the author are environment-specific and not part of the commercial solutions or support offered by New Relic. Please join us exclusively at the Explorers Hub (discuss.newrelic.com) for questions and support related to this blog post. This blog may contain links to content on third-party sites. By providing such links, New Relic does not adopt, guarantee, approve or endorse the information, views or products available on such sites.


