Amazon Elastic Compute Cloud (EC2) is a popular compute platform with abundant choices in terms of processor, storage, networking, operating system, and purchase model. EC2 offers hundreds of instance types for almost every business objective and is available across an ever-growing list of AWS Regions and availability zones globally. Customers running workloads in EC2 realize significant cost savings, business agility, operational resilience, and staff productivity. The key to achieving these benefits is observability.
Observability is complex and challenging
Often, the process of setting up your EC2 instances for monitoring is best done by building highly customized and standardized golden AMIs that are preconfigured with everything you need to get all the metrics and logs that are available to you. AMIs are valuable, but you still need to create them up front and manage them afterward. Additionally just having instance-level telemetry is not always enough for effective troubleshooting. You must also rely on application performance management (APM) to correlate the instance telemetry with your application SLOs.
New Relic addresses these challenges with our EC2 integration that enables you to seamlessly monitor your EC2 instances. When combined with agent-based instances and New Relic application monitoring, you can also contextually monitor any workloads running on them, all from one place. Using New Relic Explorer, you get a bird's-eye view of your instances’ health and faster time to troubleshooting and resolving incidents.
New Relic’s EC2 integration instruments your instances by installing our infrastructure agent on them. The agent is a lightweight executable file that collects data about your instances. It also forwards data from infrastructure integrations to New Relic and forwards log data for log analytics. You can install the agent from the simple guided install right from the New Relic One UI, or you can use specific commands to download and configure the agent for additional flexibility and customized installation. Installing the New Relic infrastructure agent is simple, straightforward, and works great for instrumenting instances one by one. In response to New Relic customer requests, we have further streamlined our process. The New Relic infrastructure agent is automatically installed the moment an EC2 instance is launched and it works for all AMIs and platforms supported by New Relic agent. This sets you up for scaled observability.
Observability made simple with AWS Quick Start for New Relic’s EC2 monitoring
As a result of our strategic partnership with AWS, New Relic is pleased to offer an AWS Quick Start solution for customers planning to run or already running workloads on EC2.
AWS Quick Starts are production-ready, automated reference solutions built by AWS solutions architects and AWS Partners. Quick Starts help you deploy popular technologies on AWS based on best practices.
It enables automatic observability of your instances, at scale, from the moment instances are launched. The automation is powered by AWS Systems Manager Automation runbooks. It scales seamlessly across your instances, spanning multiple AWS Regions and accounts, and gives you control and flexibility over which instances to monitor. This solution was inspired by the original idea presented in the New Relic AWS Cloud Keeps Getting Easier blog post.
So why should you use this AWS Quick Start?
- Automatic, at-launch monitoring for instances: Instances are automatically monitored as soon as they are launched, with no delay. You can then monitor your instances from the get-go right from your view in New Relic so you don’t lose sight of rapid changes to your instances like an auto scaling group ramping instances up or down.
- Flexibly choose instances to monitor with tags: Choose which instances to deploy the New Relic agent to, using a simple tag match for flexibility and a wide assortment of use cases. For example, you might only want to monitor instances that are assigned to your team by using a tag.
- Easily instrument your existing EC2 instances: Run the automation runbook in auto-pilot (which runs by default) for a complete hands-off experience for monitoring any new instances that you launch. Or you can run it on-demand using the AWS CLI for greater flexibility and control. For example, you may decide to monitor your existing instances with New Relic across multiple AWS Regions and accounts or on-demand using AWS CLI or an AWS Systems Manager Automation runbook for a one-time agent installation.
- Massively scalable multi-region, multi-account EC2 monitoring: Monitor instances across all AMIs and platforms supported by the New Relic agent across multiple AWS Regions and accounts.
- Spend time delivering value to your customers: The auto-pilot automation runs by default and any new instances are automatically monitored for you. You spend less time managing the agent installation and maintenance and more energy on identifying and resolving incidents faster.
- Ubiquitous: Launch your instances using any method you prefer (yes, it doesn’t matter at all) and still be able to monitor them with New Relic automatically. Here are some common ways you can launch instances in your AWS environment:
- The launch instance wizard in the AWS Management Console
- EC2 Auto Scaling group
- AWS CloudFormation templates
- AWS Cloud Development Kit (AWS CDK)
- AWS Command Line Interface (AWS CLI)
- AWS Software Development Kit (AWS SDK)
- Deep integration with AWS: Whether you’re migrating or looking for a consistent hybrid experience with AWS Outposts, your instances are automatically monitored with New Relic, an AWS Outposts Ready partner, so you can be assured it’s fully validated. The solution can be added into your AWS Control Tower landing zone customization to automatically deploy the solution for you every time a new account is enrolled.
- Enriched EC2 telemetry: Enrich EC2 telemetry collected by the New Relic infrastructure agent by complementing it with some very useful CloudWatch agent metrics. An example is the network performance metrics that you can send to New Relic seamlessly using New Relic CloudWatch Metric Streams integration.
- Faster MTTR: Visualize EC2 insights with New Relic Explorer and Dashboards to give you everything you need to stay on top of your EC2 workloads in AWS. Quickly find anomalies with Lookout and see a bird's-eye view with Navigator.
Build AWS Well-Architected EC2 instances with New Relic
Let’s take a look at how New Relic’s enriched EC2 observability helps you really scale while meeting your AWS Well-Architected goals around operational excellence, performance efficiency, and cost optimization in your instances running on AWS or in a hybrid environment using AWS Outposts.
Proactively resolve performance issues and right-size your instances based on desired network performance
Amazon EC2 now provides additional high-resolution network performance metrics to help you gain deep insights into instance network performance. These metrics and visibility help you:
- Identify when your instances exceed network allowances, which are dependent on the instance type.
- Proactively resolve performance issues and right size instances based on your SLOs around network performance.
- Run network performance benchmark tests before going to production.
- Gain clear insight into instances serving as network appliances, like firewalls, intrusion detection and prevention (IDP) systems, load balancers, and for network I/O intensive workloads like high performance compute (HPC), machine learning and big data applications.
One of the key factors in right sizing your instances is the overall performance of the instance in line with the SLOs you define. Instance performance is dependent, among other things, on the network adapter, and network performance allowances that are in turn dependent on the instance type.
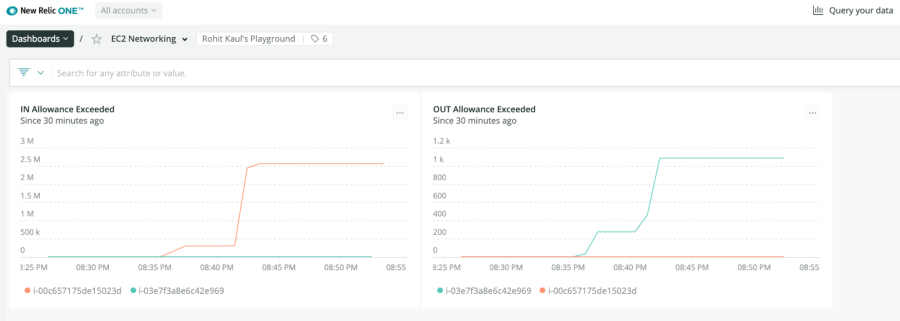
Here’s an example of an EC2 dashboard built in New Relic One. It allows you to easily identify and quickly react to alerts (potentially by right sizing) when your instances are about to exceed allowances on network bandwidth, which could otherwise result in dropped packets and performance degradation.

New Relic One EC2 networking dashboard records a spike indicating that aggregate bandwidth exceeded the allowance for the instance, causing packets to be dropped, eventually causing performance degradation.
Intuitive operational view of all your EC2 instances, at a glance
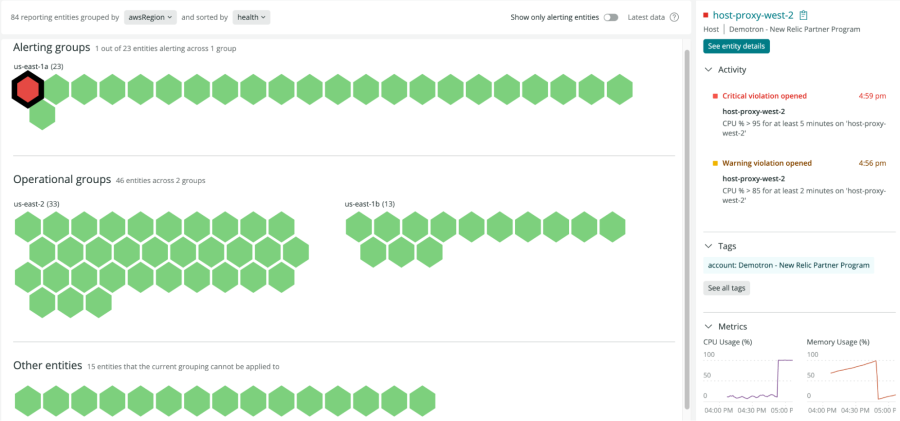
New Relic Navigator offers you a glance view of the operational health of your EC2 instances. This bird's eye view of your estate is automatically available to you, no configuration required. Navigator makes it easy for you to explore huge numbers of instances as it intuitively displays all your instances in a dense honeycomb view with traffic light colors based on alerts that you define. Quickly identify alerting instances and uncover root causes in addition to seeing which dependent systems might be affected.
As an illustration, the following Navigator view groups your instances across AWS Regions, allowing you to quickly compare and contrast your EC2 operations in a multi-region, multi-account deployment. You can group and filter across all your instances to quickly zero in on issues. You can also drill down into any instance to see a summary of its activity and any violations along with key metrics and metadata including custom attributes and AWS tags.

Quickly explore the health of your EC2 instances at a glance with Navigator—no configuration needed.
Catch anomalies and sudden changes in your instances instantly
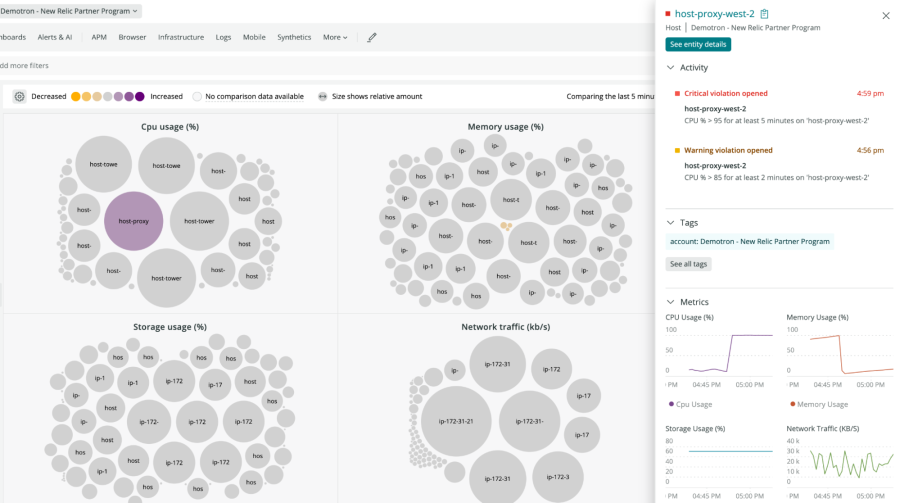
New Relic Lookout provides an intuitive view of your instances that are deviating from normal behavior, using circle visualization with color indicating severity of recent signal change and sized proportionally to the magnitude of the metric signal. Lookout automatically compares signals within the last five minutes against the previous hour.

Instantly find potential anomalies with New Relic Lookout. The brighter the color, the more severe the change, and the bigger the size, the bigger the magnitude of the signal. Then dig deeper with correlations and abnormal history to see how it impacts your whole system—no configuration needed.
Stay on or under budget with built-in cost savings recommendations
Cloud Optimize is an open-source New Relic One app available right from your New Relic One UI that can help you determine potential savings for your EC2 instances.
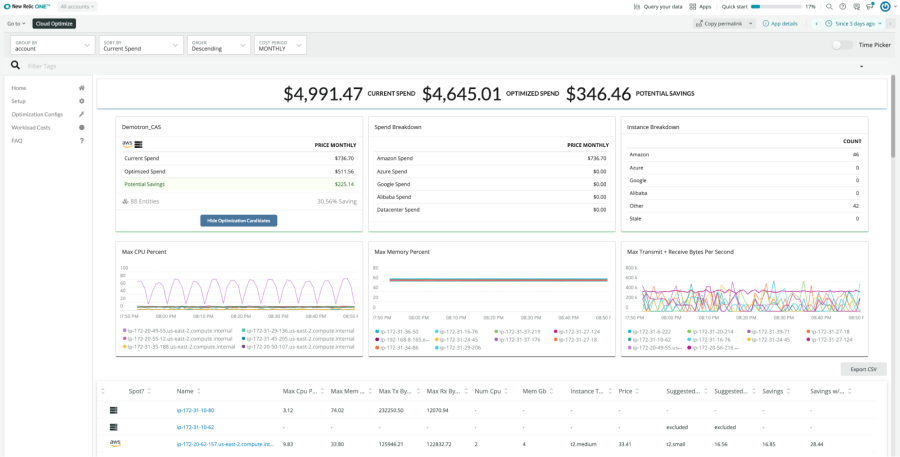
Cloud Optimize finds instances that are sized larger than necessary, and estimates your savings based on recommended downsizing. You could save hundreds, and sometimes thousands, of dollars by simply rightsizing your instances. See the following screen capture of the dashboard built into the application when it presents recommendations. For deeper insights, see this webinar.

New Relic collects AWS cost data for all your applications and AWS accounts, and then groups it to make it easier for teams to gain cost visibility. New Relic collects data from different accounts and services, and also evaluates your AWS budgets in terms of actual spend and forecasted spend.
This dashboard built into New Relic keeps track of your AWS cost metrics and budgets for your EC2 inventory. It compiles key metrics around cost and budget trend lines and presents it along with common facets like instance type and AWS Region for detailed analysis.

New Relic dashboard for keeping track of your EC2 costs and budgets.
Next steps
Learn more about how New Relic One can help you be more successful in the AWS Cloud at https://newrelic.com/platform. To deploy the AWS Quick Start for New Relic's integration with EC2, see https://aws.amazon.com/quickstart/architecture/new-relic-ec2-infrastructure/.
The views expressed on this blog are those of the author and do not necessarily reflect the views of New Relic. Any solutions offered by the author are environment-specific and not part of the commercial solutions or support offered by New Relic. Please join us exclusively at the Explorers Hub (discuss.newrelic.com) for questions and support related to this blog post. This blog may contain links to content on third-party sites. By providing such links, New Relic does not adopt, guarantee, approve or endorse the information, views or products available on such sites.


