Way back in 2016, the New Relic Security team discussed how we used New Relic Insights to monitor for potential threats and security events.
Four years later, we introduced some major changes to the New Relic platform, so we've decided to make our security dashboards more user-friendly and flexible by converting them to Nerdlets using the New Relic One SDK. That’s exactly what we’ll explain in this post. We documented our process and have made the source code available, so you can try it, too.
Escaping our “black box”
Until recently, we were using an early version of the Network Telemetry Integration. The integration sends sFlow and IPFIX data to New Relic, where we used the data in several dashboards built from long, complex NRQL queries. The dashboards showed metrics like traffic over time, anomalous traffic types, and sources by location. We even successfully used them to identify and troubleshoot at least one security incident.
The dashboard and underlying queries survived multiple iterations of team members until it became a “black box”—we knew it worked but weren’t sure how. With an ever-changing infrastructure, our queries became obsolete and our dashboard unusable. We realized if we wanted to continue tracking anomalous data, we needed a revamp.
From dashboard to app
In our previous iteration, we had a set of static queries we used to create each dashboard. To replace the static queries, we wrote a Nerdlet from scratch that lets us filter and create our own queries. It’s important to note that our Nerdlet relies on New Relic Database data produced from the Network Telemetry Integration. This is what we came up with:
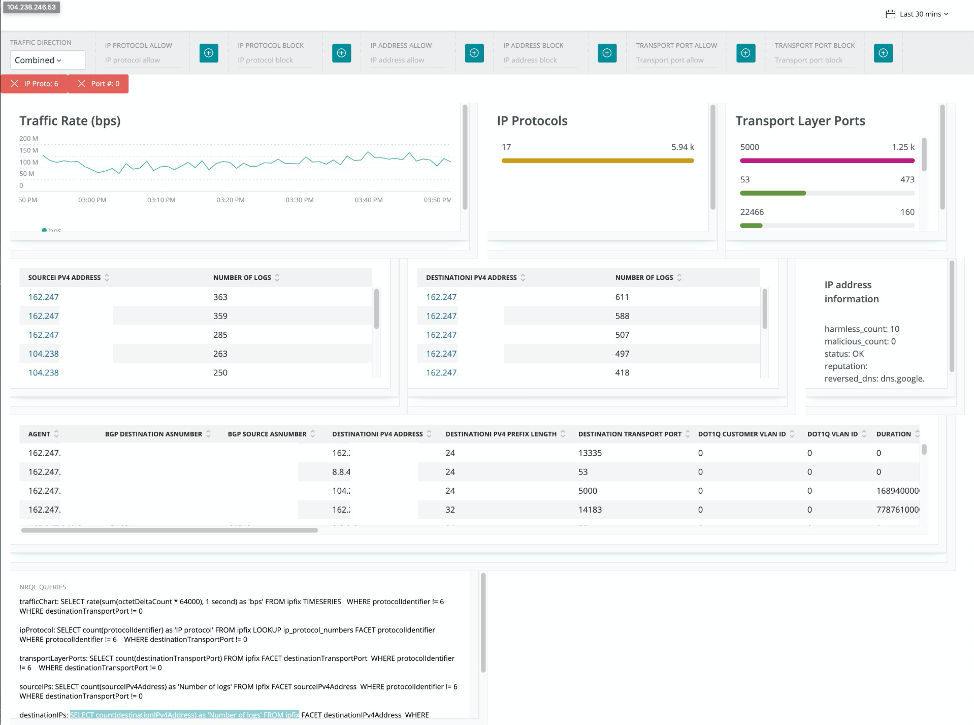
In this instance, we’re able to use the text fields at the top row to add filter values—such as removing a specific IP address or protocol number. We can also remove the filters by pressing the X next to each filter value at the top. And each time we press the + or X, the rest of the Nerdlet is re-rendered with the correct results.
Once we have a “filter set” that we like, we can copy and paste the NRQL query at the bottom and use it in an alert or dashboard. In this case, our next step is to start creating alerts focused on bandwidth usage for specific protocols we know aren’t used very often, and for network segments that shouldn’t be generating large amounts of traffic.
Now, let’s take a look at how we created this Nerdlet. We broke it down into five steps, and if you want to try something similar, you can grab the code from this gist.
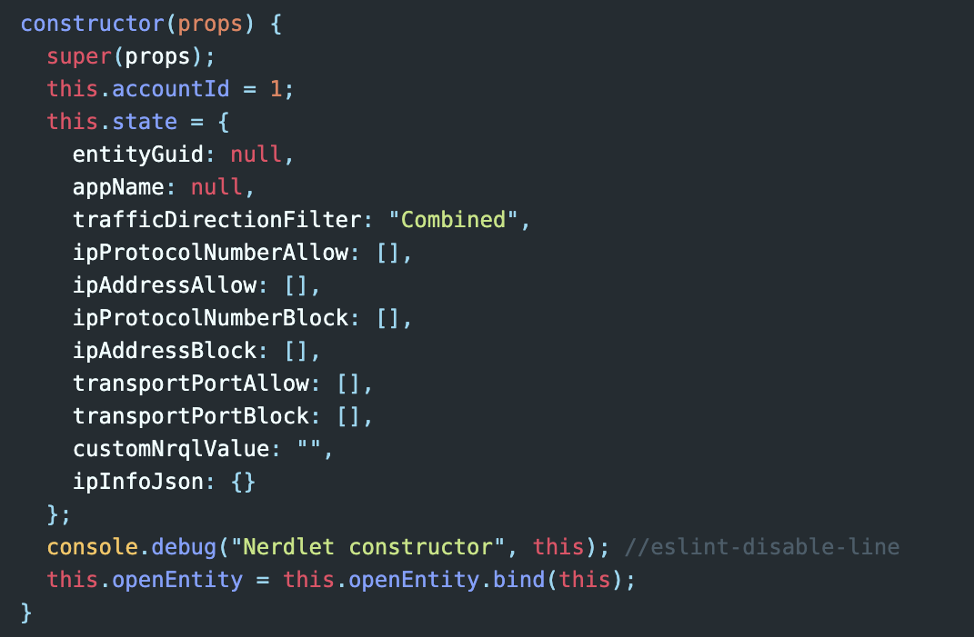
Step 1: Store search parameter values in the state
In our state object, we store several arrays, one for each filter type on the top row:
Step 2: Craft NRQL queries on the fly
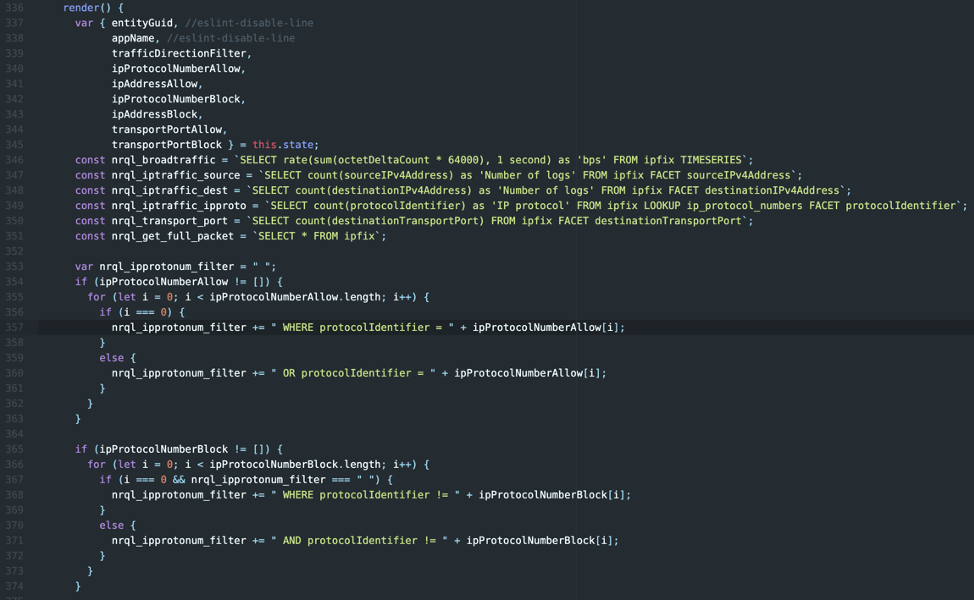
Once we have the values in the arrays, we can start building NRQL queries with simple string concatenation tricks. In the example of IP Protocol numbers, we add WHERE protocolIdentifier = <number> when we want to filter for a specific protocol number. You may also notice that this method will introduce several WHERE clauses. Thankfully NRQL interprets this behavior as multiple AND clauses.
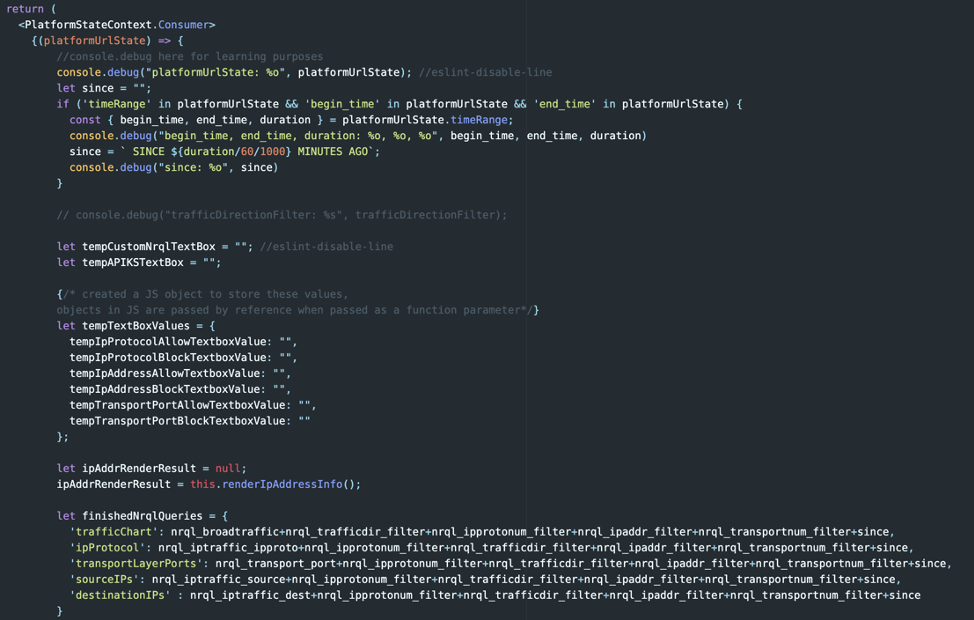
Step 3: Craft the final NRQL queries and set some temporary values for the text fields
In the beginning of our render function we set up two main things: our tempTextBoxValues object, which will hold the user-inputted values, and the final NRQL queries.
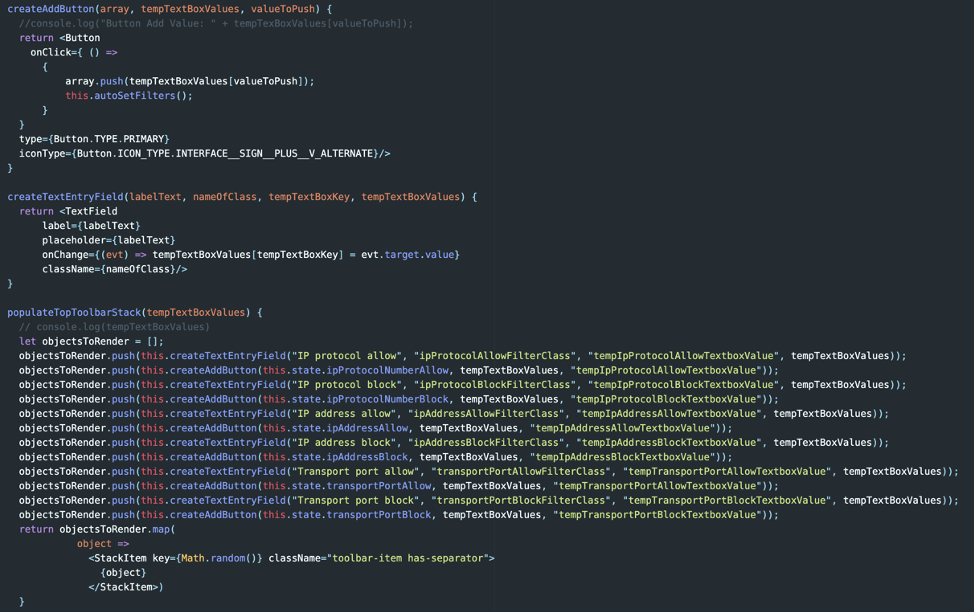
Step 4: Render the filter functionality
We created a few helper functions to render our filter bar at the top. The key was taking advantage of the fact that JavaScript will pass JSON objects by reference rather than value, allowing the onChange lambda to modify the tempTextBoxValues from step three. In our render portion of the code, we called it with one line:
{ this.populateTopToolbarStack(tempTextBoxValues) }
Step 5: Render the charts using our finalized queries
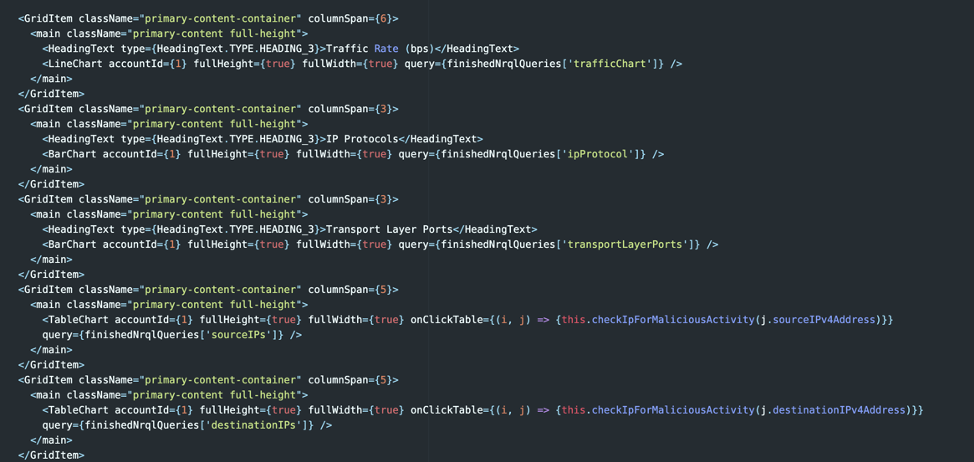
In our render block, we can now create grid items with chart objects that mirror the NR1 workshop examples but reference our finishedNrqlQueries object. When the user clicks a filter button, the autoSetFilters() function is called and will update the state object and trigger React to re-render the page.
What’s next?
What we really want is for the New Relic One platform to become our own security information and event management (SIEM), but we’re not quite there yet. For now, we plan to add pre-processing logic on logs before sending them to New Relic. This pre-processing could serve as our implementation for correlation and look for logs that occur across different event types. It seems like this may be possible in a New Relic One application, but we are still working on the idea of processing data outside the context of a browser session.
If you’re looking for ways to get more out of New Relic One, check out our catalog of available apps and accompanying blog post series.
The views expressed on this blog are those of the author and do not necessarily reflect the views of New Relic. Any solutions offered by the author are environment-specific and not part of the commercial solutions or support offered by New Relic. Please join us exclusively at the Explorers Hub (discuss.newrelic.com) for questions and support related to this blog post. This blog may contain links to content on third-party sites. By providing such links, New Relic does not adopt, guarantee, approve or endorse the information, views or products available on such sites.


