When something goes wrong, the last thing you want is to learn about the issue from a customer. Ideally, you can detect and correct the problem before your customers are affected. If things have already gone sideways, though, having the context and analysis you need is critical to ensure you’re already working on the problem when customers reach out.
Your systems are more complex than ever, and your teams, like all of us, are only human. Fortunately, you can leverage machine learning (ML) and artificial intelligence (AI) to detect, diagnose, and mitigate issues faster, wherever they occur.
At this year’s FutureStack 2021, we announced multiple innovations in the application of AI and ML to IT Operations, a field known as AIOps. Here are some tools you and your teams can use to benefit from smarter, easier detection and enhanced analysis, including Issue Maps and Incident Analysis.
Intelligent detection
Expanded anomaly detection
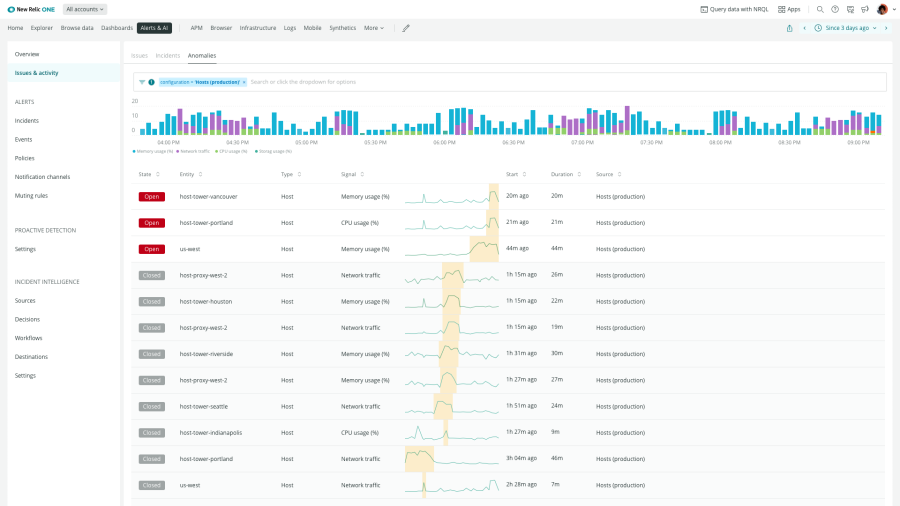
You can now detect anomalies on nearly any entity in New Relic with just a few clicks thanks to the Limited Release of expanded anomaly detection.

You can now go beyond only detecting anomalies in APM by quickly applying anomaly detection on any range of entities, through New Relic Lookout and Workloads. This allows you to spot problems nearly anywhere before they become issues.
If you already have existing anomaly detection configured, don’t worry. Those configurations will not be affected. Additionally, this expanded anomaly detection provides deeper control over the algorithm that detects anomalies, allowing for more customization if you need it.
With faster, easier, expanded anomaly detection, you can further reduce your mean time to detect (MTTD).
Sign up here to get started with expanded anomaly detection.
Smarter, easier alerting
Business services and infrastructure are always changing. Now, instead of needing to understand the expected performance of an individual service so you can manually specify a static threshold, you can easily use dynamic thresholds by creating baseline alert conditions that cover all of your services and infrastructure. These adjust to accommodate the expected fluidity and volatility of your business.
We’ve expanded our existing dynamic baseline alerting, which previously had to be individually configured for each individual signal, to allow one alert configuration to apply dynamic thresholding across up to five thousand related time series of a particular service or entity. This makes it much easier for your teams to add alert coverage to all of your entities. No team should be sitting on the sidelines and missing the benefits of incident response.
Setting static thresholds can be intimidating for many engineers. Fortunately, it is easy to create dynamic baseline alert conditions that cover all of your services and infrastructure. Just add the “FACET” clause to the NRQL queries you are using, then specify the metadata attributes that differentiate the signals that you want to monitor. Finally, you can simply adjust a slider in the user interface to set and tune the sensitivity.
Learn more about Faceted baseline conditions.
Getting to the root cause faster
Issue maps
New Relic Applied Intelligence reduces alert fatigue by correlating related incidents into a single, actionable issue that’s enriched with the context you need to understand and mitigate the issue quickly. A critical part of this is the issue page, which is a listing of all correlated issues.
When you select an issue from the issue page, you’re taken to an in-depth analysis and overview of the issue. The issue view adopts a top to bottom approach, starting with a summary of the problem. Additional information, such as probable root cause, gives you further context as you work your way down the page.
The issue map, which is part of the issue view, provides a visualization of your impacted entities. The issue map shows how your entities are interconnected so you can quickly understand if related entities are quietly misbehaving, neighboring entities are at risk, or if any downstream entities are affected.
The issue map shows, where applicable, upstream and downstream entities to better illustrate the scope and potential impact of the issue at hand. Additionally, it highlights full-stack and DevOps context like the hosts a service runs on and essential tags like owner, region, and environment.
Additionally, the issue map is interactive and deeply integrated into New Relic One. Clicking an entity opens the entity overview for full entity details. You can also hover over an entity to open a new dependency view. This view provides full context and enables bulk tagging and add-to-workloads workflows.
Learn more about Impacted entities map.
Incident analysis
New Relic Applied Intelligence automatically surfaces probable root cause. Now you can also dig into the individual incidents that make up the issue with automatic analysis on those specific signals. You can more easily investigate the problem and diagnose issues quickly with datastore analysis, which includes links to problematic queries, error analysis, code level stack traces, and external service call analysis.
Relevant dashboards
You and your teams have likely already invested in customizing your observibility by creating custom dashboards. Now you can get recommendations for most relevant dashboards that you and your teams have created, no additional configuration needed. You can immediately use the recommended dashboards to gain the context you need to solve the issue at hand instead of trying to figure out which dashboard will give you the information you need. And these recommendations will only get better the more you use them.
Learn more by checking out Issue summary in the Alerts and Applied Intelligence docs.
Next steps
If you’re new to New Relic, experience the simplicity of New Relic One yourself and sign up for a forever free account. To learn more about AIOps at New Relic, check out Alerts and Applied Intelligence.
The views expressed on this blog are those of the author and do not necessarily reflect the views of New Relic. Any solutions offered by the author are environment-specific and not part of the commercial solutions or support offered by New Relic. Please join us exclusively at the Explorers Hub (discuss.newrelic.com) for questions and support related to this blog post. This blog may contain links to content on third-party sites. By providing such links, New Relic does not adopt, guarantee, approve or endorse the information, views or products available on such sites.


