Observability is an essential part of operating modern, complex architectures. But building an observability system that consumes a wide breadth of data from numerous data sources to drive alerts with a high signal-to-noise ratio can be overwhelming. Furthermore, maintaining such configurations manually across a large organization with distributed teams creates the potential for human error and configuration drift.
A ThoughtWorks Technology Radar report suggested software teams treat “observability ecosystem configurations” as code—making observability as code an important practice for any teams adopting infrastructure as code (IaC) for their monitoring and alerting infrastructure. At New Relic, we believe that observability as code through automation is a best practice, and recommend a single source of truth for observability configurations.
In this blog post, we’ll use the IaC tool Terraform and the New Relic Terraform provider to practice observability as code. We’ll use the provider to create a monitoring and alerting configuration for a sample application based on the four golden signs of monitoring introduced in Google’s Site Reliability Engineering book:
- Latency: Measures the amount of time it takes your application to service a request. In other words, how responsive is your application?
- Traffic: Measures how much demand is being placed on your system. How many requests or sessions are aimed at your application?
- Errors: Measures the rate of requests that fail. How much traffic is unable to fulfill its requests or sessions?
- Saturation: Measures how “full” your service is. How are resources being stressed to meet the demands of your application?
You can combine these four signals to create a fairly thorough depiction of the health of your system. We’ll build the alerting strategy for our sample application based on these signals.
About the Terraform New Relic provider
Terraform is an open-source infrastructure as code tool teams use to define and provision their infrastructure (physical machines, VMs, network switches, containers, SaaS services, and more) through repeatable automation. In Terraform, any infrastructure type can be represented as a resource, and providers expose how developers can interact with their APIs. The Terraform New Relic provider, officially supported by New Relic, integrates with core Terraform to allow for provisioning and managing resources in your New Relic account.
Note: We wrote this post using version 0.12.21 of the Terraform CLI and version 1.14.0 of the Terraform New Relic provider. Future releases may impact the correctness of the examples included below.
Before you begin
To complete this walkthrough, you’ll need to install the Terraform CLI. Homebrew users can run brew install terraform. If you’re not a Homebrew user, check the Terraform download page for install instructions.
Step1: Initialize your working folder
Terraform configuration is based on a declarative language called HCL, which defines resources in terms of blocks, arguments, and identifiers. We’ll represent our New Relic resources in HCL to allow Terraform to provision and manage them.
- In your working folder, create a file called
main.tf. Include theproviderblock to signal to Terraform that the New Relic provider will be used for the plan we are about to create:
provider "newrelic" { api_key = var.newrelic_api_key } - You can now initialize Terraform, which will facilitate the download of the New Relic provider. To run the initialization, run terraform init from the console. You should see a message that shows Terraform has been initialized successfully.
- Still, in your working folder, create a file called variables.tf. Include the newrelic_api_key variable definition to allow the Terraform CLI to prompt for your New Relic Admin’s API key for your user and account, then run the plan:
variable "newrelic_api_key" {

      description = "The New Relic API key"

      type = string

}
Tip: If you want to suppress user prompts, you can also provide the API key via the NEWRELIC_API_KEY environment variable. You can combine this with a secret manager like Hashicorp's Vault to automate your Terraform runs while keeping secret values out of source control. See Terraform’s provider documentation for details.
Your working folder is now initialized, and you’re ready to begin defining your New Relic resources with Terraform.
Step 2: Provision an alert policy resource
Now we’ll define an alerting strategy for a sample app—called “Web Portal”—already reporting to our New Relic account. We want to apply the principles of golden signal monitoring and alerting to this application. To do so, we’ll first need some details about the application we’re targeting and an alert policy in which we can define the appropriate alert conditions.
- In the
main.tffile, define these resources in HCL:
data "newrelic_application" "web_portal" {

      name = "Web Portal"

}

resource "newrelic_alert_policy" "golden_signal_policy" {

     name = "Golden Signals -

${data.newrelic_application.web_portal.name}"

}
These two blocks define a data source to retrieve application context for a New Relic application named “Web Portal” and a resource for provisioning a simple alert policy with the name “Golden Signals - Web Portal.”
Take note that we’ve included two strings at the start of each block:
- The first represents the data source we are provisioning, as defined by the provider. Here we are using the newrelic_application data source and the newrelic_alert_policy (See the provider documentation for a full list of the available New Relic resource types.)
- The second is an identifier used for referencing this element from within the plan. In this case, we interpolate the application’s name, stored in its name attribute, into the alert policy name to avoid duplication in our configuration. The policy name defined here will be the one that shows in the New Relic UI, but the
golden_signal_policyidentifier is for use inside our Terraform configuration only.
- Run
terraform plan. You’ll be prompted for your admin API key. Once you enter it, you will see a diff-style representation of the execution plan Terraform is about to carry out on your behalf:
------------------------------------------------------------------------ An execution plan has been generated and is shown below. Resource actions are indicated with the following symbols: + create Terraform will perform the following actions: # newrelic_alert_policy.golden_signal_policy will be created + resource "newrelic_alert_policy" "golden_signal_policy" { + created_at = (known after apply) + id = (known after apply) + incident_preference = "PER_POLICY" + name = "Golden Signals - WebPortal" + updated_at = (known after apply) } Plan: 1 to add, 0 to change, 0 to destroy. ------------------------------------------------------------------------ - After verifying the details of the execution plan, run terraform apply to execute the plan and provision the resource:
newrelic_alert_policy.golden_signal_policy: Creating...

newrelic_alert_policy.golden_signal_policy: Creation complete after 1s

[id=643964]Apply complete! Resources: 1 added, 0 changed, 0 destroyed.
- Log into New Relic and navigate to the Alert Policies page for your account. You should see your alert policy has been created.
When you created the alert policy in step 1.3, Terraform began tracking the state of your resource. If you ran terraform apply again, Terraform would compare the configuration in your main.tf file to the internally tracked state of the resource and determine that no action is necessary—this is the power of observability as code. You can delete the policy, with terraform destroy.
Step 3: Provision alert conditions based on the four golden signals
Next, we’ll want to add alert conditions for our application based on the four golden signals: latency, traffic, errors, and saturation.
1. Latency
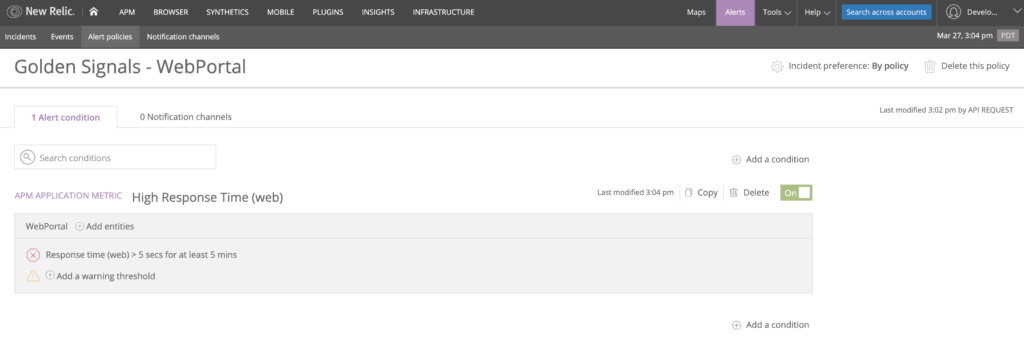
As described earlier, latency is a measure of the time it takes to service a request. Use the newrelic_alert_condition resource to create a basic alert condition resource for the response time of our sample application:
resource "newrelic_alert_condition" "response_time_web" {

      policy_id = newrelic_alert_policy.golden_signal_policy.id


      name            = "High Response Time (web)"

      type            = "apm_app_metric"

      entities        = [data.newrelic_application.web_portal.id]

      metric          = "response_time_web"

      condition_scope = "application"

      # Define a critical alert threshold that will trigger after 5 minutes

 above 5 seconds per request.

       term {

            duration      = 5

            operator      = "above"

            priority      = "critical"

            threshold     = "5"

            time_function = "all"

       }

}
Here, we defined a condition named High Response Time (web) that will trigger if the overall response time of our application rises above five seconds for five minutes. Note that for the value of the policy_id attribute, we can link the alert policy we defined earlier with a reference to its identifier and its id attribute. We’re also using the ID of the application by referencing the application’s data source we defined in the previous section and by using its id attribute.
Run terraform apply and verify that your alert condition has been created and linked to your alert policy.

2. Traffic
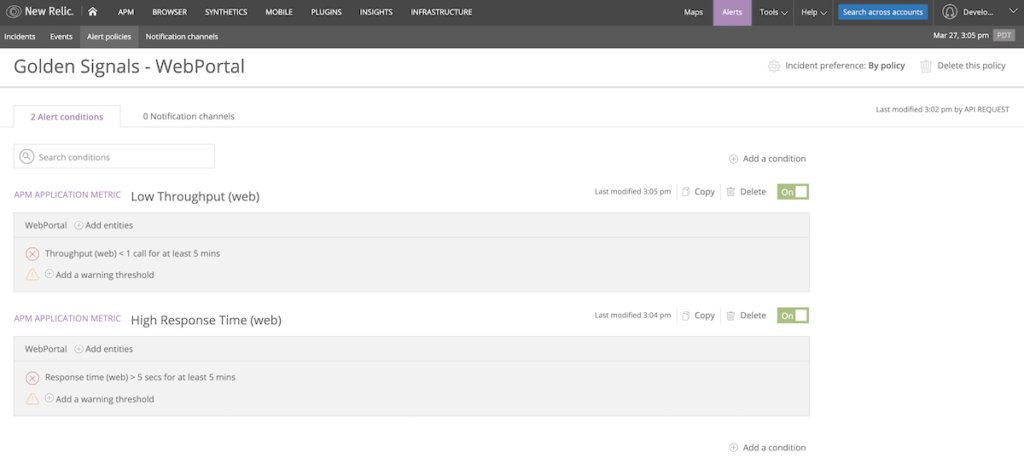
The traffic signal represents how much demand is being placed on your system at any given moment. Use the application’s throughput as a metric for measuring the application’s traffic:
resource "newrelic_alert_condition" "throughput_web" {

      policy_id = newrelic_alert_policy.golden_signal_policy.id


      name            = "Low Throughput (web)"

      type            = "apm_app_metric"

      entities        = [data.newrelic_application.web_portal.id]

      metric          = "throughput_web"

      condition_scope = "application"


      # Define a critical alert threshold that will trigger after 5 minutes

below 1 request per minute.

      term {

           duration      = 5

           operator      = "below"

           priority      = "critical"

           threshold     = "1"

           time_function = "all"

      }

}
Here, we define a condition named Low Throughput (web) that will trigger if the overall response time of our application falls below five requests per minute for five minutes. This type of alert is useful if we expect a constant baseline of traffic at all times throughout the day—a drop-off in traffic indicates a problem.
Run terraform apply to create this condition.

3. Errors
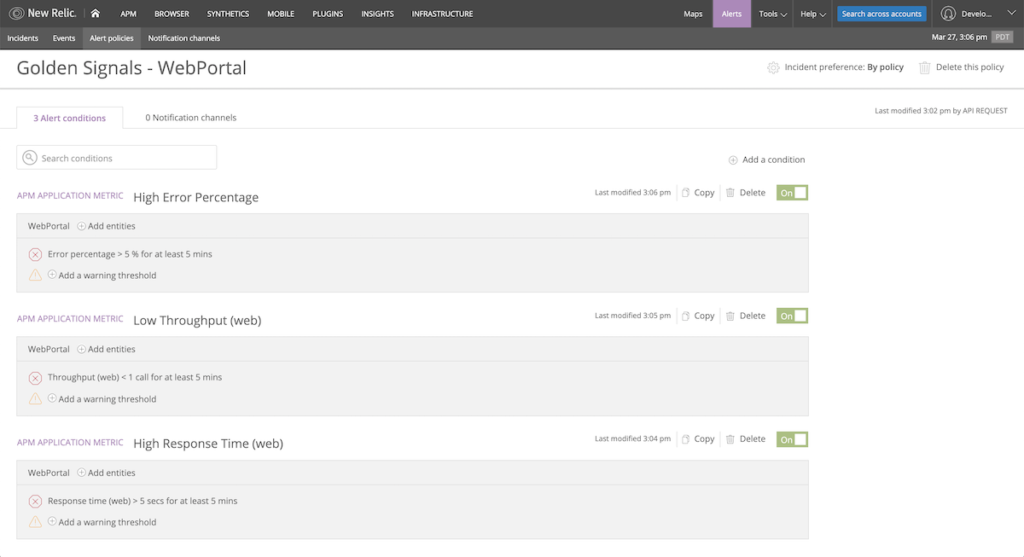
Define a condition based on the error rate generated by our application:
resource "newrelic_alert_condition" "error_percentage" {

     policy_id = newrelic_alert_policy.golden_signal_policy.id


     name = "High Error Percentage"

     type  = "apm_app_metric"

     entities = [data.newrelic_application.web_portal.id]

     metric = "error_percentage"

     runbook_url = "https://www.example.com"

     condition_scope = "application"


     # Define a critical alert threshold that will trigger after 5 minutes above a 5% error rate.


     term {

          duration      = 5

          operator      = "above"

          priority      = "critical"

          threshold     = "5"

          time_function = "all"

     }

}
This condition, error percentage, will trigger if the overall error rate for our application rises above 5% for five minutes.
Run terraform apply to create the condition.

4. Saturation
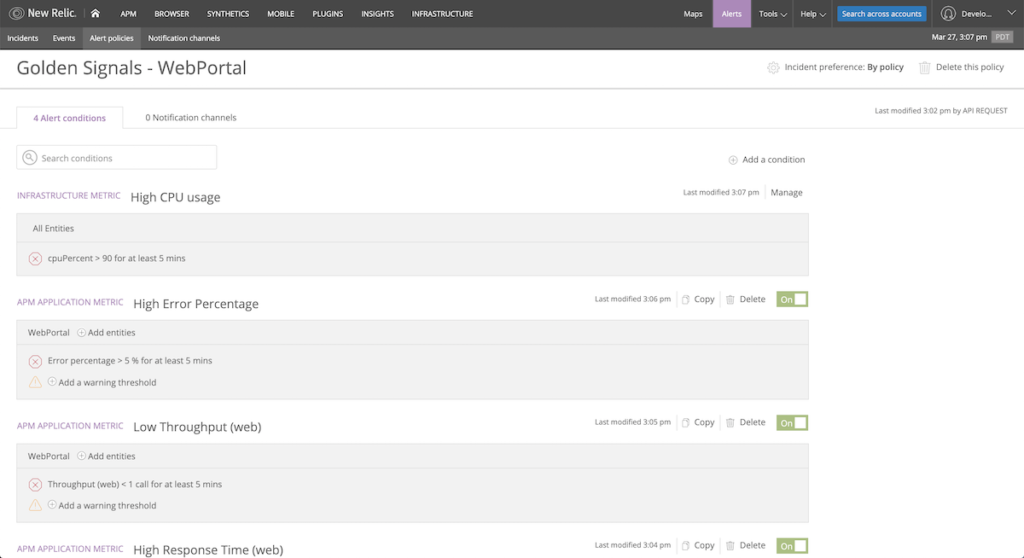
Saturation represents how “full” your service is and can take many forms, such as CPU time, memory allocation, or queue depth. Let’s assume that in this case, we have a New Relic Infrastructure agent on the hosts serving our sample application, and we’d like to measure their overall CPU utilization. Use the newrelic_infra_alert_condition resource to create an alert condition based on this metric:
resource "newrelic_infra_alert_condition" "high_cpu" {

     policy_id = newrelic_alert_policy.golden_signal_policy.id


     name        = "High CPU usage"

     type        = "infra_metric"

     event       = "SystemSample"

     select      = "cpuPercent"

     comparison  = "above"

     runbook_url = "https://www.example.com"

     where       = "(`applicationId` = '${data.newrelic_application.web_portal.id}')"


     # Define a critical alert threshold that will trigger after 5 minutes above 90% CPU utilization.


     critical {

           duration      = 5

           value         = 90

           time_function = "all"

     }

}
This alert will trigger if the aggregate CPU usage on these hosts rises above 90% for five minutes. Note that the definition for this resource is slightly different from the definition of newrelic_alert_condition—the New Relic provider documentation is the best source of information about the required or optional attributes on the resource.
Run terraform apply to create the condition.

Your resources are now fully defined in code, and you can run terraform destroy or terraform apply at any time to remove or re-provision these resources in your New Relic account in a matter of seconds.
Linking a notification channel
We’ve created alert conditions for the four golden signals of our application in our New Relic account. Now we’ll want to set up notifications on those alerts. Our team uses PagerDuty, so let’s create a notification channel to integrate with that service. (For a full list of the supported notification channels, see the newrelic_alert_channel documentation.)
- Create a variable to store the PagerDuty service key to avoid storing sensitive values in your codebase. In
variables.tf, create a new variable:
variable "pagerduty_service_key" { description = "The Pagerduty service key" type = string } - Define the channel with the
newrelic_alert_channelresource, and link it to your policy defined earlier with thenewrelic_alert_policy_channelresource:
resource "newrelic_alert_channel" "pagerduty_channel" { name = "Page Developer Toolkit Team" type = "pagerduty" config { service_key = var.pagerduty_service_key } # The following block prevents configuration drift for channels that use sensitive data. # See the Getting Started guide for more info: # https://www.terraform.io/docs/providers/newrelic/guides/getting_started.html lifecycle { ignore_changes = [config] } } resource "newrelic_alert_policy_channel" "golden_signal_policy_pagerduty" { policy_id = newrelic_alert_policy.golden_signal_policy.id channel_ids = [newrelic_alert_channel.pagerduty_channel.id] } - Run
terraform applyto apply your configuration.

Observability as code in practice
Congratulations, you’re now a practitioner of observability as code. Now it’s time to create a repository—perhaps in GitHub—for your observability configuration and place it under version control.
As your team evaluates the alerting system you’ve put in place, you’ll find that you may need to tweak configuration values, such as the alert threshold and duration. You can do this with a pull request to your alerting repository. Since you’re practicing observability as code, your team can review these changes right alongside the rest of your code contributions. You may also want to consider automating this process in your CI/CD pipeline, taking your observability as code practice to the next level.
Don’t miss our video quick tip: Terraform Provider for New Relic—Getting Started Guide
The views expressed on this blog are those of the author and do not necessarily reflect the views of New Relic. Any solutions offered by the author are environment-specific and not part of the commercial solutions or support offered by New Relic. Please join us exclusively at the Explorers Hub (discuss.newrelic.com) for questions and support related to this blog post. This blog may contain links to content on third-party sites. By providing such links, New Relic does not adopt, guarantee, approve or endorse the information, views or products available on such sites.


