New Relic Browser is the most deployed real user monitoring (RUM) tool in the world.
Originally an extension of New Relic APM, Browser was designed to give developers and software engineers context around their end users’ experiences. Like all New Relic products, Browser provides the quick context necessary to solve problems in the modern software stack.
If you run a business on the internet, here’s a fact: Your users spend 90% of their time waiting for their web browsers to load data from your servers. Here’s another: 100% of your end-user experience depends on your entire technology stack—from your infrastructure to your application to the browsers that ultimately render your application, you need the ability to identify, diagnose, and resolve issues quickly across all of your backend and frontend services.
These facts make frontend (or end-user) monitoring a critical component of a successful digital business strategy. It’s absolutely essential to understand your end-user experience and the relationship between website performance and the health of your business. By focusing on and measuring what happens after a server sends information to the web browser and your end users, frontend monitoring allows your business to understand the earliest interactions your users have with your applications. Real user monitoring (RUM), as the name suggests, measures actual user interactions with a website or web application. This is where New Relic Browser succeeds.
New Relic Browser dominates the RUM market
According to the website profiler BuiltWith, New Relic Browser was the second most widely deployed, browser-based APM solution, behind Google Analytics. New Relic Browser is deployed on nearly 1.8 million websites—over 20 times more sites than any comparable monitoring solution.
(Since Browser helps developers and engineers configure alerts, remediate errors and issues, and optimize page performance at the code level, and Google Analytics is more useful for measuring the performance of campaigns, marketing content, and page clicks, we’ve removed Google Analytics from the results.)
Of the million most trafficked sites, New Relic Browser is deployed almost 10 times more frequently than the closest competitor:
New Relic Browser agents are deployed on nearly 30% of the top 10,000 websites today:
What makes New Relic Browser so dominant? We believe its popularity and usage depend on three factors:
It’s built with modern web experiences in mind.
It’s closely integrated with the larger New Relic platform, particularly New Relic APM.
It’s easy to set up, and its time to value is immediate.
1. Built for the modern web experience
Built specifically with developers and ops professionals in mind, Browser provides quick, at-a-glance feedback to help developers make sense of user performance across dimensions, geos, and networks. Out of the box, developers can set alerts, establish baselines, and visualize page performance. However, Browser is essential for modern web experiences because of its:
- SPA handling
- User-centric performance metrics
- AJAX monitoring
- JavaScript error monitoring
- Support for custom attributes
SPA ready
The internet has changed since the days of web 1.0, when pages were mostly composed of HTML and image files. Single page applications (SPAs) have grown in popularity because they provide a fast and responsive user experience, and they offer benefits like eliminating needless page reloads and HTML fetching when deployed.
Browser is SPA ready regardless of the SPA framework you use. It requires very little work to configure for SPA monitoring, and it automatically captures performance data and throughput for page loads and route changes, AJAX request data, synchronous and asynchronous JavaScript activity, and dynamic page updates associated with your SPA application. With Browser, you’ll get a full understanding of how your users experience your app’s page loads and route changes.
User-centric performance metrics
For a long while, “page load times” as measured by the window.onload event was the standard for most RUM products—Browser included. But such metrics don’t clearly answer questions like “How fast is our site?”
User-centric performance metrics like first paint and first contentful paint—recently released by Browser—tell a more complete picture of the end-user experience and better help answer questions like “How much time passes before users see content?” and “How much time passes before users can interact with elements on the page?”
From a user perspective, these metrics help answer questions like those posed by Google Chrome Engineering Manager Addy Osmani in his widely read blog post, Web Page Usability Matters: “Loading a page is a progressive journey with four key moments to it: Is it happening? Is it useful? Is it usable? And is it delightful?” Using first paint and first contentful paint metrics in Browser gives you a much more precise way to measure the exact moments when your users perceive that your site has started to render content, which is what really matters to them.
AJAX monitoring
AJAX is an important client-side tool for developers who want to provide a fluid, satisfying user experience. With AJAX, developers can build web pages to dynamically update content by sending and receiving data from the server asynchronously without having to reload an entire page.
As described in our documentation, Browser’s AJAX page shows recent AJAX requests from browsers to external endpoints, such as HTTP or HTTPS domains. This information helps identify problems with your users’ experience when you have time-consuming or failing AJAX calls that update parts of a webpage on your site. For example:
- Timing problems: Total time percentages, throughput requests per minute (rpm), and average data transfer rates per request can help identify timing problems.
- Endpoint problems: Status codes related to the requests provide information about the return behavior from the call. A large number of non-200 status codes may indicate a problem with your AJAX endpoints.
- Specific webpage location problems: If applicable, related session traces allow you to explore AJAX problems within the context of the page where they are loaded.
JavaScript error monitoring
According to industry analysts like RedMonk, JavaScript is the most popular programming language today, and it’s most commonly used (alongside HTML and CSS) to make web pages interactive. Needless to say, JavaScript errors come in all forms: they can be as inconsequential as a one square-inch ad not displaying correctly, or as impactful as a user’s web browser ceasing to respond.
When you need to prioritize and recreate JS errors, Browser is an invaluable tool. With JS error handling, you can sort errors based on segments that matter to your business—helpful when determining error impact and remediation priority—and use applied intelligence to layer additional context into specific errors and identify the stack trace, individual URI, and specific steps that led to an error. For engineers who need to recreate errors locally, these capabilities are invaluable.
Support for custom attributes
The New Relic Browser agent provides an API to specify extra details associated with a page view or browser interaction. For example, by forwarding custom attributes from APM data or by specifying custom attributes through JavaScript, developers can increase the value of their RUM data to inform more about their user experience. Since all sites are unique, it’s beneficial for site owners to measure specific page elements to extend Browser’s out-of-the-box value. For example, Browser can be used to collect, integrate, and compare other key web page elements and customer-specific data like:
- Hero images
- User information (conversion info, login ID, and account name)
- E-commerce transaction information (cart size and order value)
- A/B tests
2. It’s one part of the larger New Relic experience
Metrics gathered from RUM allow you to tell useful and powerful stories about your websites. But when you connect those stories to what you know about the rest of your software stack—from the infrastructure layer to the microservices powering your application—that’s when you can fully understand the impact of each change or enhancement and how they shape your end users’ experience.
Our main users are developers and operations professionals who often rely on monitoring to troubleshoot issues and identify problems; they need to easily navigate from real user monitoring to the application layer to the infrastructure layer in as few clicks as possible. When we talk to New Relic customers, we often hear about “major wins” that reinforce the value of the entire platform. One customer, for example, recently told us: “A home run for us was simply that we could see the frontend and compare it with the backend.”
Browser integrates with the rest of the New Relic platform in a number of ways. For example, you can easily connect into all transaction traces associated with an HTTP request to quickly troubleshoot transaction errors. Or by aligning your RUM data from Browser with the data available in New Relic Synthetics, you can better understand your lab data as it compares to your field data, benchmark your competition, and proactively eliminate outages and poor performance before your customers notice a problem.
If you build and manage microservices, New Relic’s distributed tracing will help you identify latency more quickly across distributed systems and better isolate latency between your frontend and backend services. As New Relic expands distributed tracing to capture transactions in web browsers and mobile devices, you’ll be able to gain context more quickly and resolve issues faster than ever before.
3. It’s easy to set up and recognize immediate value
“Having worked with other RUM solutions, I know how challenging they can be to configure. I’ve seen customers in my previous roles take weeks to get their pages instrumented,” said Josh Rhinehart, a solutions consultant at New Relic. “It was nice to be able to install Browser and see data in minutes.”
Browser is extremely easy to deploy—an advantage which is surely a factor in the number of New Relic deployments we’ve seen. If you’re an existing APM user, you can automatically deploy the Browser agent by allowing the APM agent to inject the necessary JavaScript snippet for browser monitoring. With this deploy method, you’ll get automatic updates as we release new features, and you don’t have to perform any manual steps to keep your agents up to date.
Once you’ve installed the agent, you can jump right into learning about your customers’ end-user experience. For example, you can use the New Relic One chart builder to create widgets for New Relic One dashboards to track perceived performance metrics, AJAX requests, and JavaScript errors.
To help you get started, here are two examples that you can copy and paste into the New Relic One chart builder:
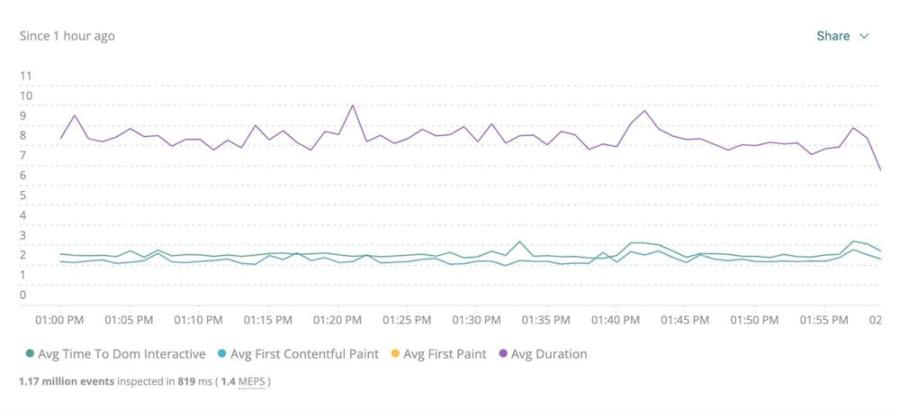
Example 1: perceived performance metrics
Query
SELECT average(timeToDomInteractive), average(firstContentfulPaint), average(firstPaint), average(duration) FROM BrowserInteraction TIMESERIES

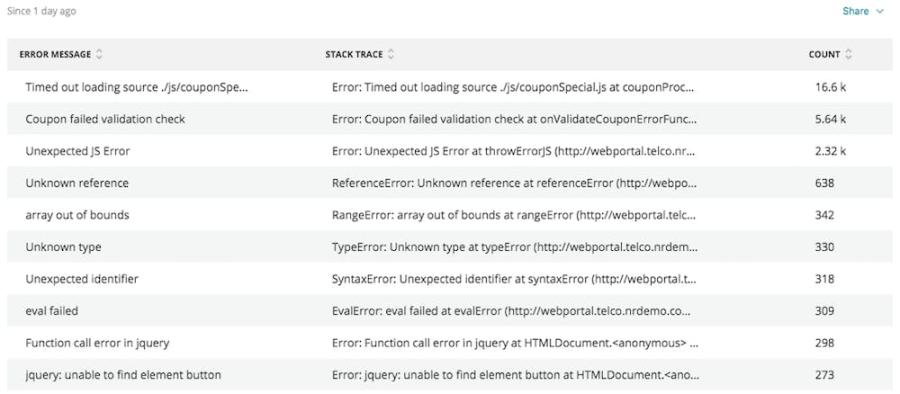
Example 2: JS errors
Query
SELECT count(*) FROM JavaScriptError FACET errorMessage, stackTrace SINCE 1 day ago

New Relic Browser: Modern software built for modern problems
Today, shipping an application frontend is a challenging endeavor. Developers have to focus first and foremost on user experience. But they’re also asked to release new features and content constantly while also relying on third-party services like content distribution networks. Trying to satisfy users coming across thousands of different device types, on constrained networks, is exhausting for site owners. Tracking perceived performance metrics, supporting popular development practices like SPAs, and maintaining your sites with reactive and proactive real-user monitoring is more important than ever. Browser simplifies this complexity by providing exceptional time to value, monitoring built for modern web experiences, and a direct connection to the larger New Relic platform.
If you haven’t done so already, install New Relic Browser and learn why it’s the most popular RUM solution in the world.
The views expressed on this blog are those of the author and do not necessarily reflect the views of New Relic. Any solutions offered by the author are environment-specific and not part of the commercial solutions or support offered by New Relic. Please join us exclusively at the Explorers Hub (discuss.newrelic.com) for questions and support related to this blog post. This blog may contain links to content on third-party sites. By providing such links, New Relic does not adopt, guarantee, approve or endorse the information, views or products available on such sites.


