With the release from Amazon Web Services (AWS), we’re announcing support for Amazon Virtual Private Cloud (VPC) Flow Logs via Amazon Kinesis Data Firehose to reduce the friction of sending logs to New Relic. Using VPC flow logs from across your AWS estates, you can quickly understand key insights for performance analytics and improve troubleshooting of network connectivity.
Amazon VPC enables you to launch AWS resources into an isolated and secure virtual network with the benefits of using scalable AWS infrastructure.
With the New Relic Amazon VPC Flow Logs integration, you’ll be able to:
- Monitor and issue alerts about network traffic from within your VPC in New Relic.
- Visualize network performance metrics like bytes and packets per second, as well as accepts and rejects per second across every TCP or UDP port.
- Explore flow log deviations to look for unexpected changes in network volume or health.
- Diagnose overly restrictive security group rules or potentially malicious traffic issues.
AWS is delighted to continue our strategic collaboration with New Relic to help customers innovate and migrate faster to the cloud. New Relic’s connected experience for Amazon VPC Flow Logs, paired with the simplicity of using Kinesis Data Firehose, enables our joint customers to more easily understand how their networks are performing, conveniently explore traffic flows across their VPC resources, and more quickly troubleshoot networking issues.
At New Relic, we understand that network telemetry is challenging even for network engineers. To unlock cloud-scale observability, engineers need to explore VPC performance and connectivity across multiple accounts and regions, rapidly pivoting on both facets and context, before diving into analyzing related endpoints to answer “Is it the network?”
To solve this, we’ve streamlined the delivery of VPC flow logs by allowing you to send them to New Relic through Kinesis Data Firehose, which can reduce costs and pipeline complexity. With our simple Add Data interface, it only takes moments to configure VPC flow logs using the AWS CLI or to generate a CloudFormation template.
Instead of digging through raw logs across multiple accounts, all engineers can begin with an Amazon EC2 instance they own and begin to explore the data that matters, regardless of the AWS account or region.
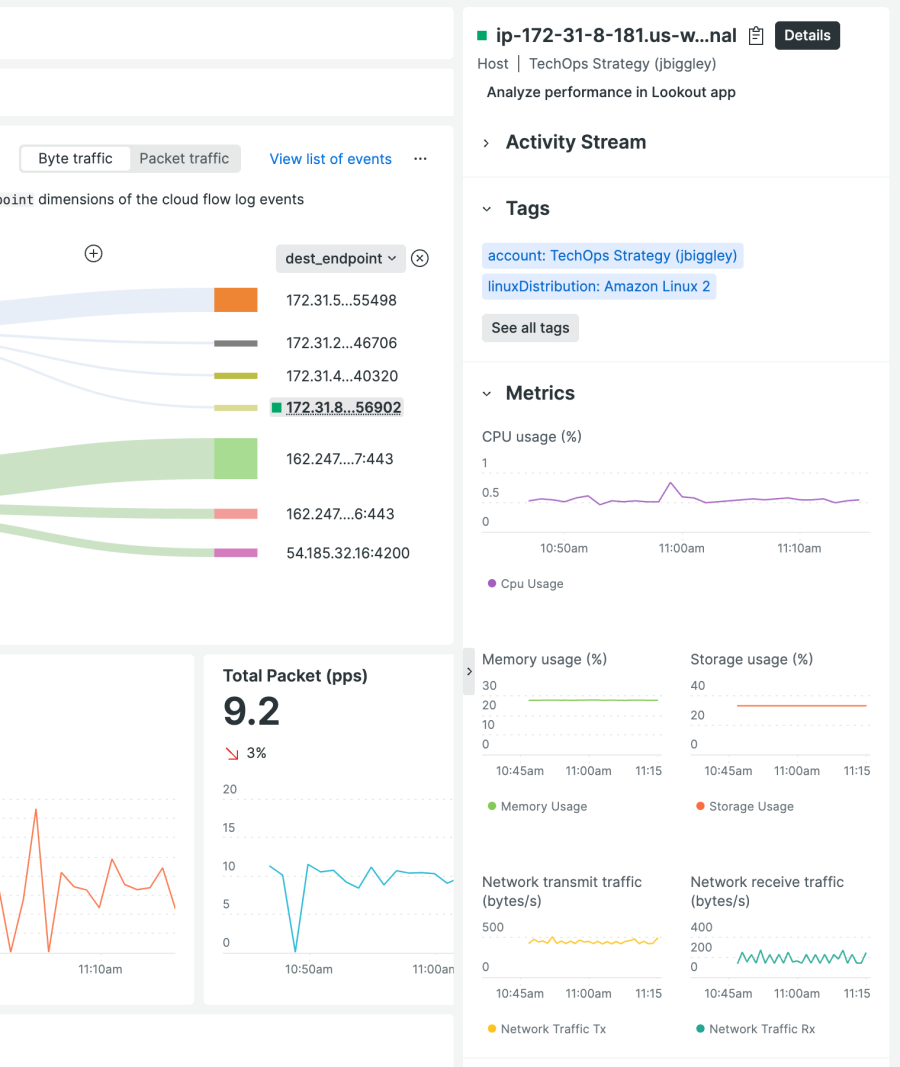
When you need to find the monitored entity using VPC flow logs, the Sankey diagram view automatically links to known hosts monitored through the New Relic infrastructure agent. With facets including instanceId and IP address, a single click will show an overview of the host, including triggered alerts and events, tags, golden metrics, and other critical data points, to help you correlate VPC network and host performance indicators.

When you need to explore VPCs across AWS regions, availability zones, and accounts, the network monitoring experience provides curated insights into traffic patterns and changes in packet loss in a single view.
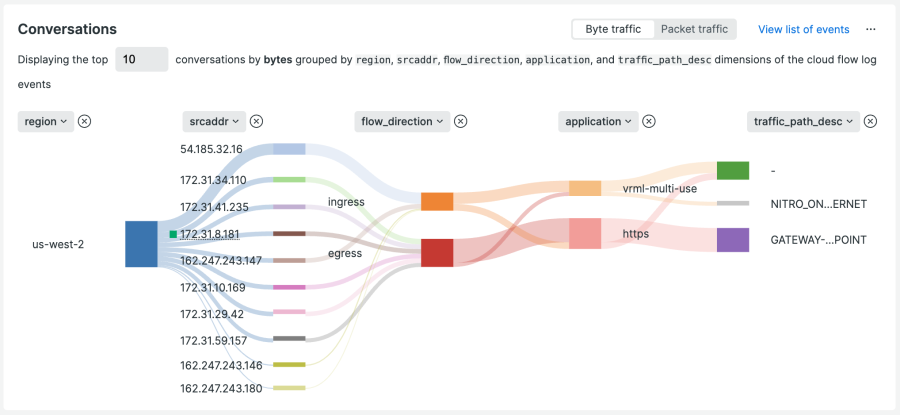
To dig deeper, you can use New Relic for easy visualization of VPC performance across any available dimension in your VPC flow logs, toggling between bytes and packets to understand both aspects of the traffic.

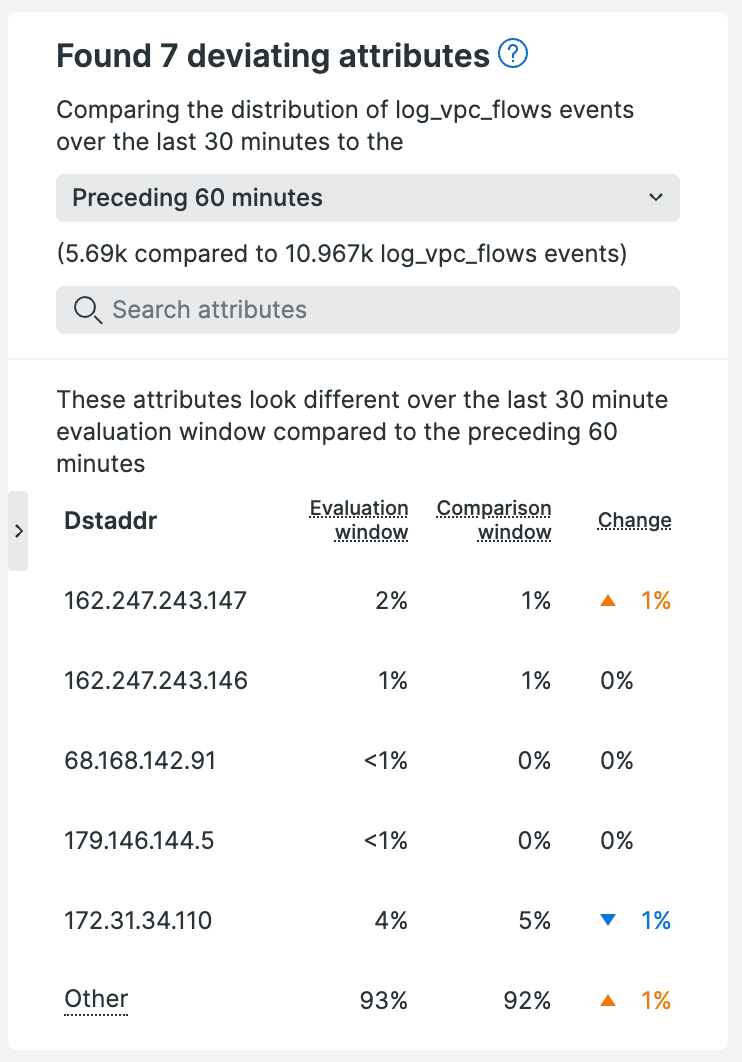
To understand changes in flow logs, use the deviating attributes sidebar to explore variances across all facets of network traffic.

To visualize the variances in flow log facets, select the Explore flow log deviations button to open New Relic Lookout. You can visualize bytes and packets per second along with accepts and rejects per second across a list of known applications for both TCP and UDP ports.
Use New Relic Explorer to view a list of all VPC networks discovered from ingested VPC flow logs and a summary of key metrics about each network. Quickly narrow in on VPCs where unexpected changes in volume or health indicate emerging problems using the curated golden metrics from our open source entity definitions.
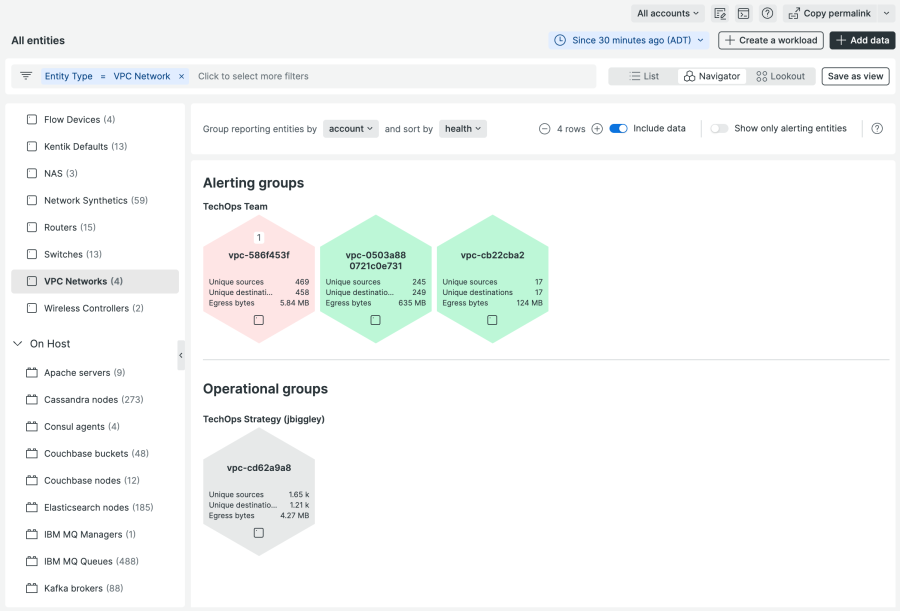
To visualize performance across large AWS estates, switch to the New Relic Navigator view to quickly group networks by health and other metadata. You can quickly pinpoint where New Relic alerts have triggered the “stoplight” colors of red, yellow, and green, and you can see the overlaid performance metrics.

And to understand “Is this normal?” switch to the Lookout view to visualize the variances across the four key metrics, egress bytes, unique sources, ingress bytes, and unique destinations. Lookout automatically compares values from the last five minutes compared to the preceding 60 minutes.
Adding network telemetry, including Amazon VPC Flow Logs, is an essential step towards observability maturity.
Our architecture contains above 200 microservices running on AWS. When something goes wrong, we need to find the root cause quickly to put out what we at Gett term as 'fires.' With New Relic capabilities we can identify the problem, understand exactly what services were affected, what’s the reason, and what we need to do to resolve it. New Relic gives us this observability—it helps us to provide better service for our customers.
How to configure this integration
With a guided configuration that supports both the AWS CLI and CloudFormation, you can quickly define the VPCs that will ship flow logs, opt to sample or send all logs, and quickly explore VPC telemetry using network performance monitoring in New Relic.
- If you are not already a customer, sign up for a free account.
- In New Relic, select Add data and search for VPC flow logs.
- Follow the guided installation to configure your AWS environment to send VPC flow logs to New Relic using a Kinesis Data Firehose.
- Explore your VPC flow logs using network performance monitoring, New Relic Explorer, Navigator, and Lookout.
- You’ll be able to use the curated flow logs view shown in New Relic infrastructure monitoring.
Also, you can read the documentation or watch this video for more information about how to use this integration.
Next steps
Sign up today for a free New Relic account to start your observability journey and take advantage of the 100 GB/month of data ingest, one full-platform user, and unlimited basic users.
The views expressed on this blog are those of the author and do not necessarily reflect the views of New Relic. Any solutions offered by the author are environment-specific and not part of the commercial solutions or support offered by New Relic. Please join us exclusively at the Explorers Hub (discuss.newrelic.com) for questions and support related to this blog post. This blog may contain links to content on third-party sites. By providing such links, New Relic does not adopt, guarantee, approve or endorse the information, views or products available on such sites.


