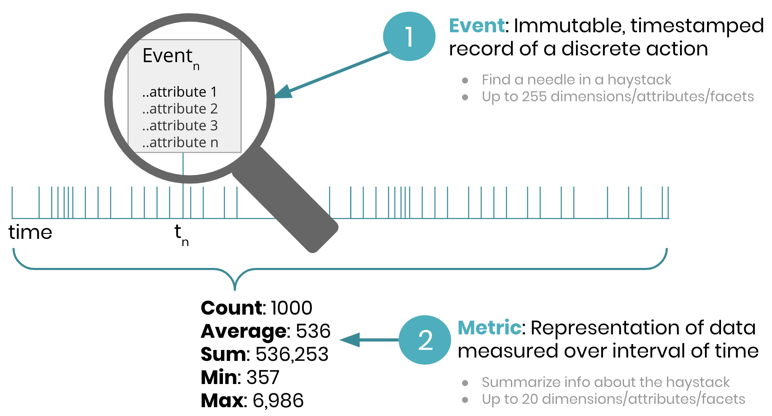
Events are a critical telemetry data type for observability, providing discrete, detailed records of significant points for analysis. Common examples of events include deployments, transactions, and errors. Monitoring events helps you do fine-grained analysis in real time.
Your event data, sent by New Relic agents and the Event API, can provide the information you need when troubleshooting issues in your system. Since a specific event represents a fixed moment in time, it can provide important information to help you determine the precise moment a problem occurred. For example, you can insert a custom event every time a user places an order on your website, and record the user id, dollar amount, number of items bought, and processing time.
However, it may not always be cost effective or practical to retain this level of granularity for all your data. Large volumes of event data consume significant storage resources. So for those transactions that require high-cardinality, granular information, events are great. But you might not want to collect an event for everything your business does.
For example, let's say that you want to keep a year-over-year history of transaction response times for your website: If you decided to store an event for every transaction, that could significantly increase your storage costs. Alternatively, tracking aggregated transaction data using the metric data type may be a better fit.
From a monitoring perspective, metrics provide an aggregated view of your event data and are more efficient for capturing trends over longer time ranges. For example, you could aggregate transaction response times for your website to one metric and then examine the data month-over-month.

Today we’re excited to introduce a faster, more efficient way to store and analyze your event data with our events-to-metrics service, which is available now for all customers. Read on to learn more about how it works.
The events-to-metrics service: optimization for long-term analysis
As part of the New Relic One platform, the events-to-metrics service converts your event data into aggregated dimensional metrics for long-term storage and analysis. This conversion allows for more efficient data storage, which in turn provides faster results on your data queries and chart creations.
Like any data type, you can use metrics to identify trends and anomalies by analyzing the KPIs that are important to you. You can also query these converted metrics and build dashboard widgets alongside your existing events, logs, traces, and third-party metric data.
Note: The event-to-metrics service does not delete events; instead, it creates metrics from the event data without altering the event, and stores the aggregated metric data for 13 months.
How the events-to-metrics service works
To convert your event data using this service, you’ll use the New Relic GraphQL API. (If you’re not already familiar with this API, check out our Intro to GraphQL API and explore your data with the GraphiQL API tool).
Here’s how it works:
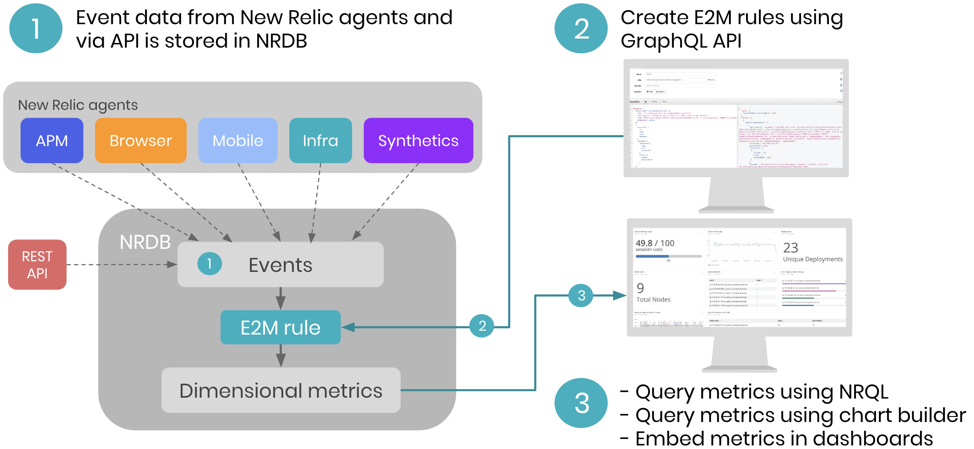
- Event data sent from New Relic agents or the event API are stored in New Relic Database (NRDB)
- You create and manage event-to-metrics rules using the following GraphQL mutations:
- Create new metrics from events
- Delete existing events-to-metrics rules
- Enable or disable events-to-metrics rules
- You query metrics using the New Relic Query Language (NRQL) or use chart builder to embed metrics widgets in dashboards.

Example event-to-metrics conversion
Let’s take a look at an example of how to use this service: Suppose you want a metric you can use to chart the average transaction duration of your APM applications over the past six months, with the ability to filter and facet by httpResponseCode and a custom attribute you’ve named customerSegment. With the events-to-metrics service, you would do this by creating a metric called transaction.responseTime from the duration reported by your APM Transaction events.
Specific steps include:
- Create a rule that looks like this:
SELECT summary(duration) FROM Transaction AS ‘transaction.reponseTime’ FACET httpResponseCode, customerSegment
- Use the GraphiQL tool to construct your API request with the following attributes:
- Rule name
- Rule description
- NRQL query from step 1
- Account ID
- Query the metric like this:
FROM Metric SELECT average(transaction.responseTime) WHERE numeric(httpResponseCode) = 200 SINCE 6 MONTHS AGO TIMESERIES
To learn more, check out the full events-to-metrics documentation, or contact your New Relic account team.
New to New Relic and want to learn more about how telemetry data works on our platform? Check out M.E.L.T. 101: An introduction to the four essential telemetry data types.
The views expressed on this blog are those of the author and do not necessarily reflect the views of New Relic. Any solutions offered by the author are environment-specific and not part of the commercial solutions or support offered by New Relic. Please join us exclusively at the Explorers Hub (discuss.newrelic.com) for questions and support related to this blog post. This blog may contain links to content on third-party sites. By providing such links, New Relic does not adopt, guarantee, approve or endorse the information, views or products available on such sites.


