Are you interested in knowing how fast your site is for the customers that are getting the slowest response times? What about understanding which web transactions are causing poor outlier performance? You now have the ability to see this information through a new feature we're rolling out: histograms and percentiles.
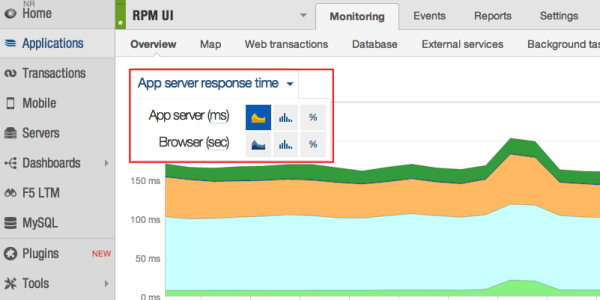
Histograms and percentiles bring a new look to your overview page. You can now toggle between your application's and browser's average response times, histograms and percentiles all from a single drop down. Check it out.
Averages are great, but sometimes they don't tell the whole story because in a typical web application outliers will drag the average up. Histogram and percentile charts will give you the ability to see which transactions are responsible for the slowest outlier performance. Combined with the average response time, histograms and average give you the complete view of your web application performance.
Percentiles

Our percentile charts give you the ability to see the average, median,95th, and 99th percentile charts on one graph.
Sometimes you have a transaction that has a consistent average but when you look at the 95th percentile you see a spike. The example above is a transaction that has a consistent average and median but when you look at the 95th percentile it is terrible. We were able to learn that there was a caching problem affecting a small number of customers and quickly fixed the problem so that the
95th percentile returned to normal.
Histograms
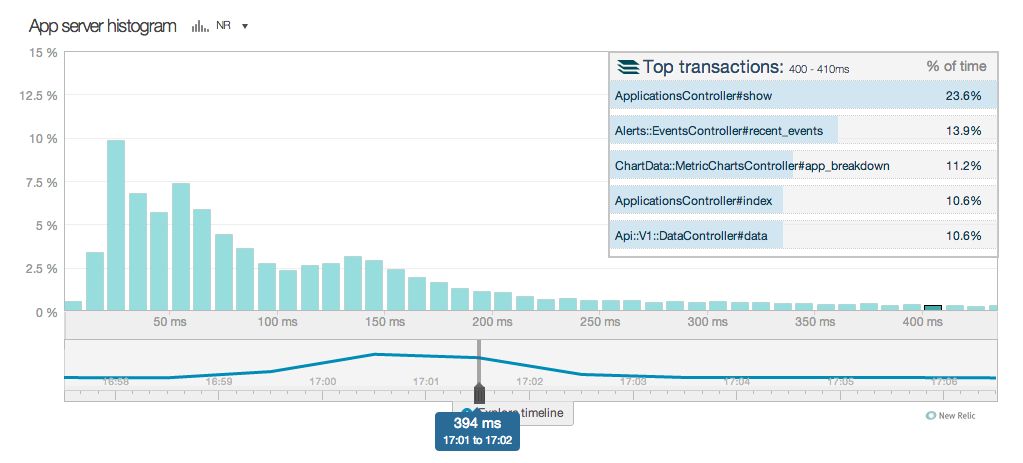
Histograms are a great way to dig into the long tail of your response times. Is your spread of requests flat or does it have an obvious spike? Is it single or multi- modal? When you've found something interesting in your distribution you can click on the request bin and get a breakdown of the top 5 transactions that occurred during that time to pinpoint the problem.
Histograms and percentiles are available to all customers starting today
Histograms and percentiles are free for all customers and are available on both individual web transactions and the overview pages. You'll see them immediately for browser data but to get histogram and percentile support at the app level you'll need to upgrade to the latest version of your agent.
The views expressed on this blog are those of the author and do not necessarily reflect the views of New Relic. Any solutions offered by the author are environment-specific and not part of the commercial solutions or support offered by New Relic. Please join us exclusively at the Explorers Hub (discuss.newrelic.com) for questions and support related to this blog post. This blog may contain links to content on third-party sites. By providing such links, New Relic does not adopt, guarantee, approve or endorse the information, views or products available on such sites.


