The world runs on software; how much software exists, though, is something we can only speculate about. At any given moment, there are millions of custom applications running on a variety of platforms and operating systems—an endless collection of services, daemons, and APIs that keep business processes and our data alive.
Instrumenting that software is at the heart of New Relic’s mission. We provide hundreds of integrations that connect with the most popular infrastructure services and applications, whatever the execution context. Those integrations are tailored to each service, so that you can enjoy a curated data experience right from the start.
Our curated approach works well for popular services and applications, such as MySQL, Redis, and NGINX. But what about the millions of custom applications that power thousands of companies? There’s no way we could write an integration for every custom application you create. You can, though: You just need New Relic Flex.
What is New Relic Flex
New Relic Flex is an application-agnostic, all-in-one tool that allows you to collect metric data from a wide variety of services. Flex’s approach is different from that of dedicated integrations: Instead of interfacing directly with services, Flex instructs the New Relic Infrastructure agent to listen to standard structured output, which Flex then processes and collects as metric data for Infrastructure.

With this approach, you can instrument any application that exposes metric data in some way or another, whether it’s from JSON over HTTP or from standard output in a shell session, and combine that data with all your other critical telemetry data in New Relic One. The amount of services you can instrument is only limited by the data sources supported by Flex, which are growing and are open for contribution. If a service can talk, chances are that Flex can listen.
How to Get Started With Flex
New Relic Flex comes bundled with the Infrastructure agent, and you configure and enable it like any other New Relic integration: Create a config file, start the agent, and then Flex listens to the data sources you’ve defined. The collected data can then be parsed and filtered using Flex functions before it generates and sends metric samples.
To get started with Flex, edit the YAML configuration file under integrations.d:
- Linux:
/etc/newrelic-infra/integrations.d - Windows:
C:\Program Files\New Relic\newrelic-infra\integrations.d\
Configuring Flex
Below is an example of an integration config file with Flex parameters for two data sources (highlighted). The values in name and event_type are used to generate the sample names in New Relic, so that you can query your data later. Notice that the data sources are composed of paths (where the data must be taken from) and functions (what to do with that data).
integrations:

 - name: nri-flex # We're telling the Infra agent to run Flex!

   interval: 60s

   timeout: 5s

   config: # Flex configuration starts here!

     name: sample_source

     apis:

      - event_type: apiCallSample # Name of the event in New Relic

        url: https://jsonplaceholder.typicode.com/posts

        method: POST

        payload: >

          {"title": "foo","body": "bar","userId": 1}

      - event_type: commandSample # Name of the event in New Relic

        commands:

          - run: du -c /somedir

            set_header: [dirSizeBytes,dirName]

            regex_match: true

            split: horizontal

            split_by: (\d+)\s+(.*)

          - run: some_other_command

            split_by: \s+
What if you want to create multiple Flex configurations? Flex is pretty flexible—pun intended— about that: You can add as many nri-flex config blocks as you need...
integrations:

 - name: nri-flex

   config:

     name: flexName_1

 - name: nri-flex

   config:

     name: flexName_2

 - name: nri-flex

   config:

     name: flexName_3
...or link to separate Flex configuration files:
integrations:

 - name: nri-flex

   config_template_path: /path/to/flex/integration.yml
With Flex functions you can accomplish a wide variety of tasks on the data collected by Flex. Examples include:
math: Perform math operations on the datasample_include_filter: Preserve only the designated key-value pairsvalue_parser: Extract values from the data using regular expressions
In the Flex repo you can find more than 200 examples of custom integrations, including many Linux and Windows services and command-line utilities.
Now, let’s look at a couple examples of how to use Flex.
Example: Integrating LibreNMS with Flex
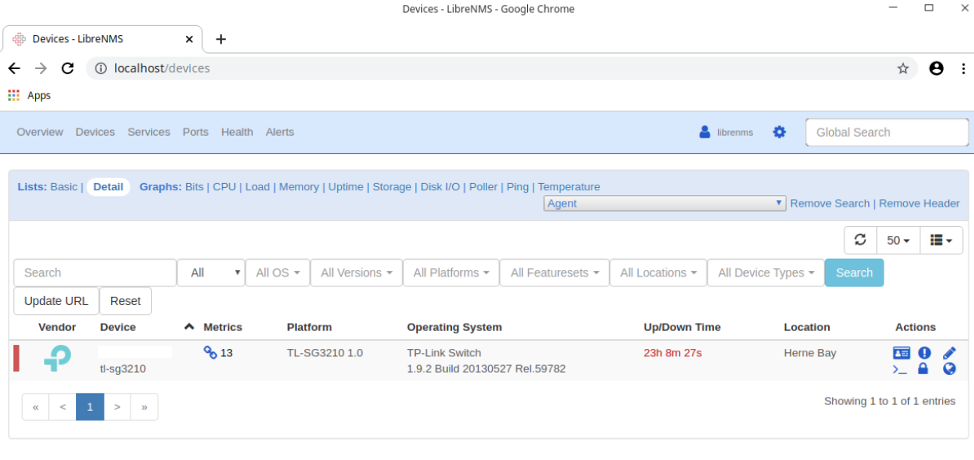
LibreNMS is a popular network device monitoring system. It comes with its own web API, which serves data as JSON over HTTP. In this example, let’s assume we have a switch we’re monitoring with LibreNMS, and its API is accessible by the New Relic Infrastructure agent.

With the following configuration, we’ve instructed Flex to use an authentication token to send a GET request every 30 seconds to the /ports endpoint of LibreNMS for capturing ifInOctets and ifOutOctets.
integrations:

 - name: nri-flex # We're telling the Infra agent to run Flex!

   interval: 30s

   config:

     name: librenms

     apis:

      - event_type: librenmsSample

        url: http://localhost/api/v0/ports?columns=ifAlias%2Cport_id%2CifInOctets_rate%2CifOutOctets_rate

        headers:

          X-Auth-Token : <redacted_token>
The sample output looks like this:
{

  "status": "ok",

  "message": "",

  "port": [

    {

      "port_id": "4444",

      "ifAlias": "tl-sg3210",

      "ifInOctets_rate": "387",

      "ifOutOctets_rate": "596"

    }

  ]

}
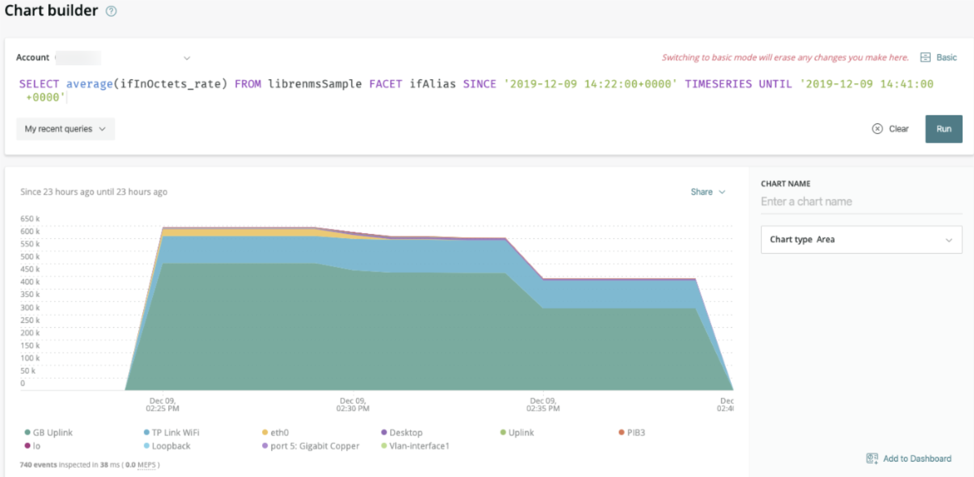
Since LibreNMS returns the data in JSON, we don’t need to do anything else: As soon as we save the configuration, Flex starts listening to the data coming from the URL and converts it into samples. Charting the LibreNMS data using New Relic One is just a matter of composing a NRQL query in chart builder:
Example: Monitoring config files’ sizes in Linux
True to the Unix philosophy, Linux has a whole range of useful command-line utilities that help monitor different aspects of the filesystem. It’d be great to get their data into New Relic Infrastructure, don’t you think?
To instrument the Linux filesystem with Flex, invoke the command API, with functions to split the data and set proper headers. In this case, we’re going to keep a watch on the size of config files using the stat command. Have a look at the YAML file:
integrations:

 - name: nri-flex

   config:

     name: linuxFileSize

     apis:

      - name: linuxFileSize

        commands:

          - run: stat -c '%n;%s' /etc/*conf

            split: horizontal

            set_header: [fileName,fileSizeBytes]

            regex_match: false

            split_by: ";"
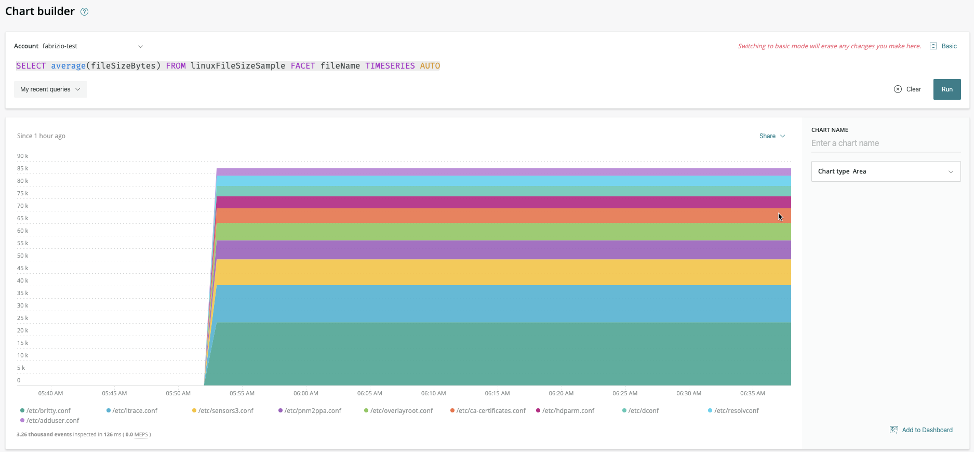
Save the file—be mindful of the indentation—and run the following query in chart builder:
SELECT average(fileSizeBytes) FROM linuxFileSizeSample FACET fileName TIMESERIES AUTO
There it is, the size of your config files. Want to get notified of changes? Use the NRQL query to set up an alert and New Relic will do the rest.
Join the Flex community today
With Flex, the possibilities are endless, and the entry barrier is so low. If you feel excited about Flex like I am, head over to the Flex open source repository and follow our step-by-step tutorial.
And remember, Flex is an open source project: You can contribute in many ways, from adding examples to improving the docs. Pull requests are welcome—and new functions are added almost every week.
So, what cool stuff do you plan on instrumenting with Flex?
Want to learn more about how New Relic enables lightning fast queries? Check out Inside NRDB: A Flexible, Unified Database Built to Scale
The views expressed on this blog are those of the author and do not necessarily reflect the views of New Relic. Any solutions offered by the author are environment-specific and not part of the commercial solutions or support offered by New Relic. Please join us exclusively at the Explorers Hub (discuss.newrelic.com) for questions and support related to this blog post. This blog may contain links to content on third-party sites. By providing such links, New Relic does not adopt, guarantee, approve or endorse the information, views or products available on such sites.


