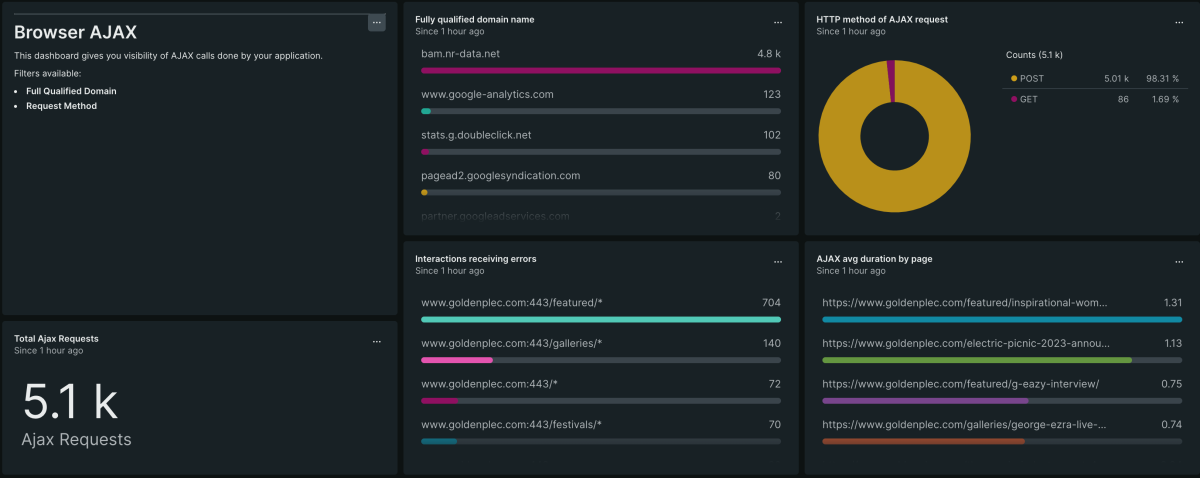
What's included?
A dashboard that displays the performance of your Ajax Request
Benefits of understanding AJAX requests
-
Identify performance issues: By reviewing AJAX requests in New Relic, you can identify performance issues with your application. New Relic provides detailed metrics on AJAX requests, such as response time, throughput, and error rates, which can help you identify performance bottlenecks.
-
Troubleshoot errors: If an AJAX request fails or returns an error, New Relic can provide detailed information on the error, including the status code and error message. This information can help you quickly identify and troubleshoot errors in your application.
-
Monitor third-party dependencies: If your application depends on third-party services, you can use New Relic to monitor the performance of those services. New Relic can provide insights into the performance of AJAX requests to third-party services, such as response time and error rates.
-
Optimize application performance: By reviewing AJAX requests in New Relic, you can identify opportunities to optimize your application's performance. For example, you may identify slow-loading AJAX requests that can be optimized by reducing the size of the payload or optimizing the code.
Distributed tracing with AJAX requests in a microsystem architecture can provide several benefits:
-
End-to-end visibility: Distributed tracing allows you to trace the flow of a request across multiple services in your microsystem architecture. With AJAX requests, you can trace the request from the client-side through to the server-side, allowing you to see the complete end-to-end flow of the request.
-
Performance monitoring: Distributed tracing can provide valuable insights into the performance of your microsystem architecture. By tracing the flow of requests, you can identify bottlenecks and optimize the performance of your system.
-
Debugging and troubleshooting: Distributed tracing can make it easier to debug and troubleshoot issues in your microsystem architecture. By tracing the flow of a request, you can quickly identify which service is causing the issue and address it.
-
Root cause analysis: Distributed tracing can help you identify the root cause of issues in your microsystem architecture. By tracing the flow of requests, you can identify the root cause of a problem and take steps to prevent similar issues from occurring in the future.

