What's included?
dashboards
2
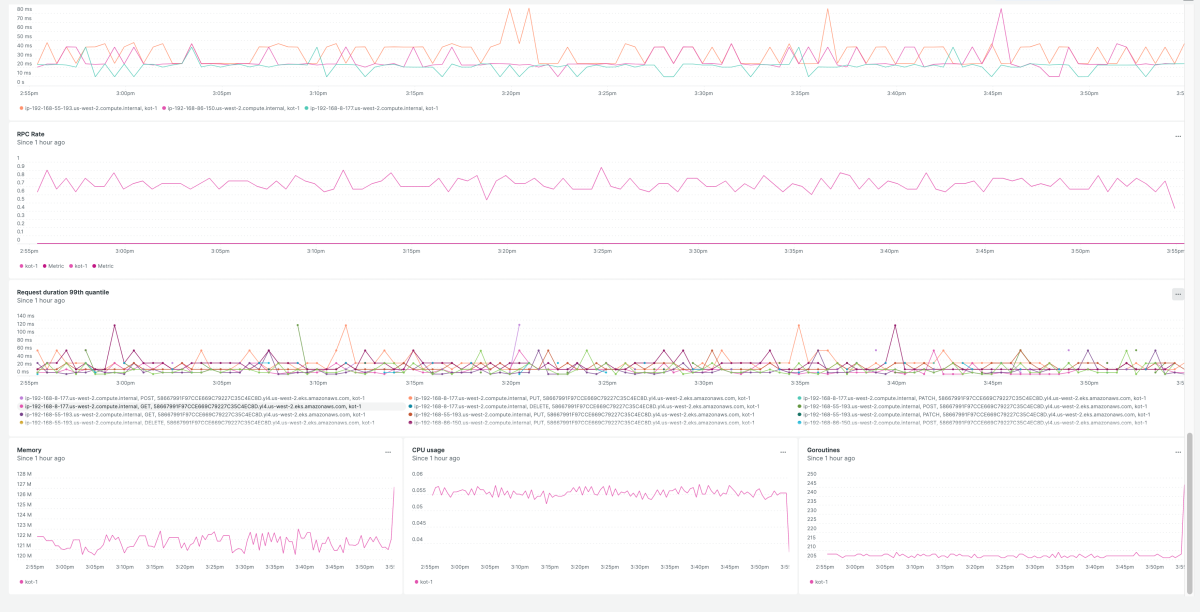
Kubernetes (Prometheus) quickstart contains 2 dashboards. These interactive visualizations let you easily explore your data, understand context, and resolve problems faster.
Kubernetes / Kubelet
Kubernetes / Compute Resources
documentation
3
Kubernetes (Prometheus) observability quickstart contains 3 documentation reference. This is how you'll get your data into New Relic.
alerts
0
This quickstart doesn't include any alerts. Do you think it should?
You can edit this quickstart to add helpful components. View the repository and open a pull request.
You can edit this quickstart to add helpful components. View the repository and open a pull request.
View repo
View repo
What is Kubernetes?
Kubernetes is an open-source system for automating deployment, scaling, and, management of containerized applications. The New Relic Kubernetes (Prometheus) monitoring quickstart utilizes Prometheus to give you visibility into your Kubernetes clusters and workloads in minutes, whether your clusters are hosted on-premises or in the cloud. Follow the instructions here to install the New Relic Kubernetes integration.
What is Prometheus?
Prometheus is an open-source monitoring and alerting toolkit.
Kubernetes (Prometheus) quickstart highlights
The New Relic Prometheus quickstart for Kubernetes utilizes the New Relic Prometheus agent to build dashboards that allow you to proactively monitor your metrics, like:
- memory and cpu utilization
- running pods and containers
- kubelet pod start metrics
- compute resources by pod, node, cluster, and namespace and more.

