What's included?
dashboards
1
Traceloop quickstart contains 1 dashboard. These interactive visualizations let you easily explore your data, understand context, and resolve problems faster.
traceloop
documentation
1
Traceloop observability quickstart contains 1 documentation reference. This is how you'll get your data into New Relic.
alerts
0
This quickstart doesn't include any alerts. Do you think it should?
You can edit this quickstart to add helpful components. View the repository and open a pull request.
You can edit this quickstart to add helpful components. View the repository and open a pull request.
View repo
View repo
Why monitor Traceloop?
Monitoring Traceloop provides valuable insights into the performance and quality of your Large Language Model (LLM) applications.
Comprehensive monitoring quickstart for Traceloop
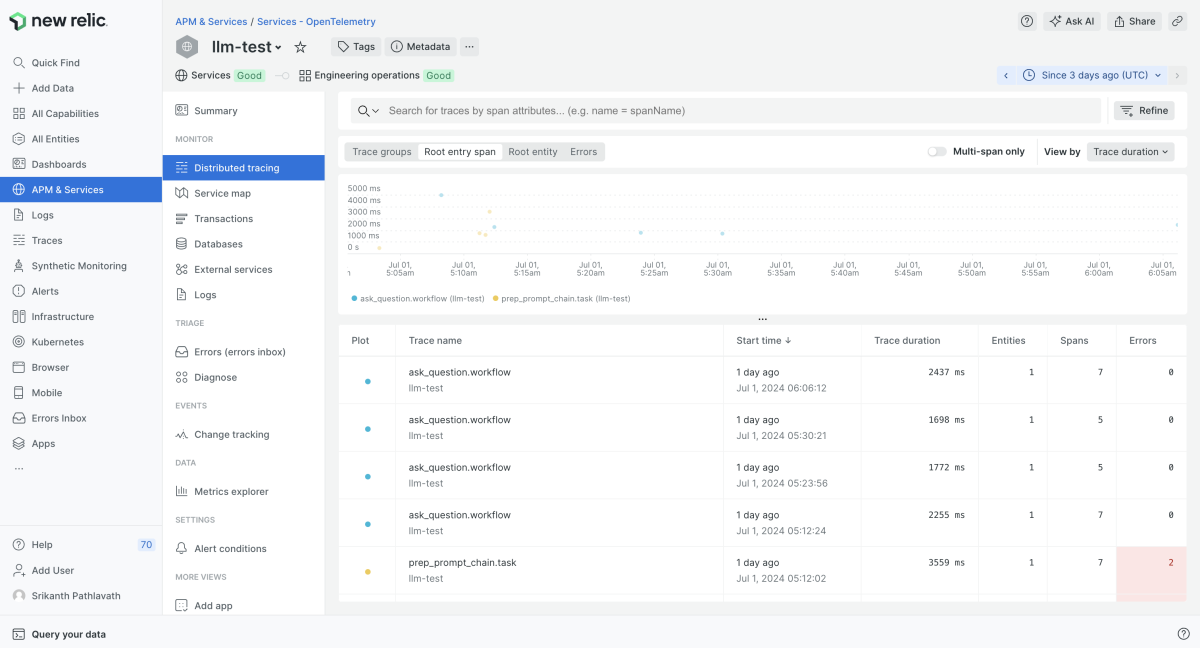
Monitoring Traceloop LLM observability will allow you to effectively track Gen AI completion tokens, prompt tokens, total llm used tokens, model name, and temperature, while utilizing New Relic's application performance monitoring features to gain deep insights into application behavior, transaction traces, enabling users to obtain a holistic view of application performance.
What’s included in this quickstart?
New Relic Traceloop LLM observability monitoring quickstart provides quality out-of-the-box reporting:
- Dashboards (completion tokens, prompt tokens, total llm used tokens, model name, and temperature etc)


