Detect and fix problems before they impact your users
Monitor, visualize, troubleshoot, and alert on all your Lambda functions in a single experience.
-
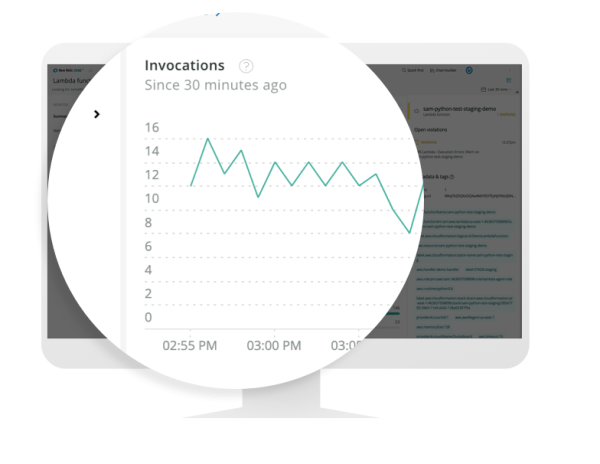
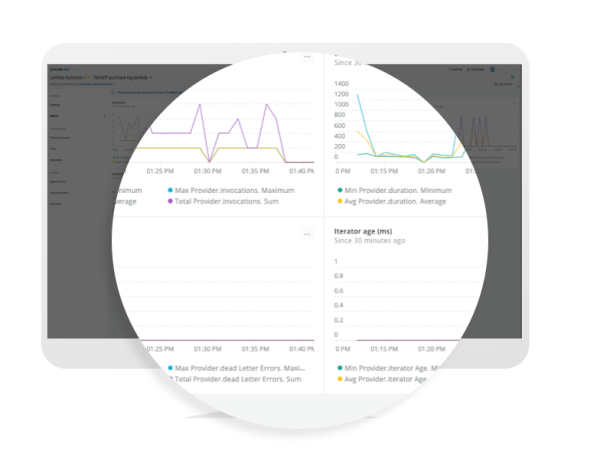
Monitor overall activity across your entities and then drill into specific functions in the friendly UI that contains AWS Lambda-specific data like throughput, error rate, and more.
-
See detailed telemetry about function execution and data about connected components (like other AWS services). Then dive deeper into those components affecting AWS Lambda executions through New Relic Distributed Tracing, all at very high cardinality, allowing you to find even uncommon issues.
-
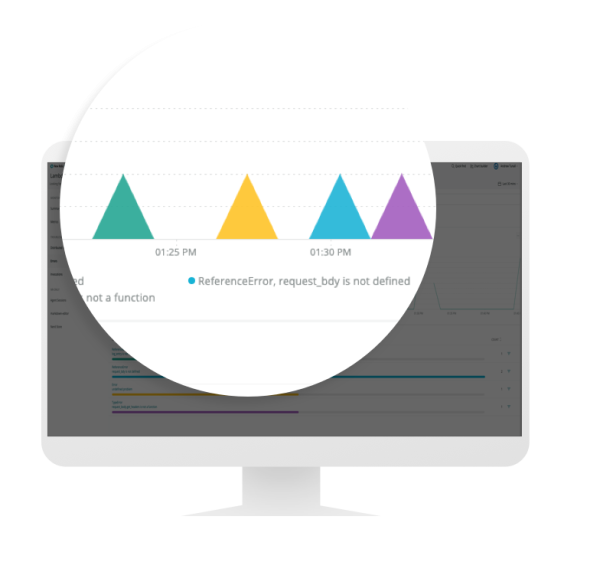
Observe all your event data along with spans (external service and external HTTP requests, code execution, database queries, etc.), stack traces, error data, invocation source data, and other relevant information.


Visibility across your entire estate
From traditional monoliths to microservices and serverless components, keep your entire array of cloud services in view.
-
With access to a comprehensive dataset, you can determine if a function is behaving inconsistent with expectations and drill in to troubleshoot any problems with a specific request.
-
View tracing for your legacy application components alongside the performance of all your new, modern services and components from backend infrastructure to client-side apps.
Scale serverless applications without worry
With real-time dynamic views across your entire stack, you can manage and maintain your services with stability no matter how quickly or how often your applications grow and change.


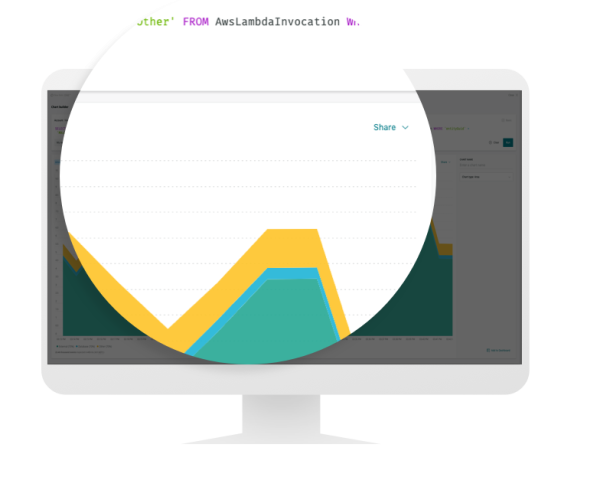
Capture and visualize your data without writing new code
Spend less time instrumenting and more time building. New Relic enables developers to rapidly auto-instrument monitoring and observability to their serverless functions without requiring code changes via our New Relic CLI Installer and Lambda Layer.
Collect and correlate all your data in one place
New Relic One gives you unified observability for all your systems from one open, connected, and programmable platform.
Try New Relic Serverless for AWS Lambda
Monitor, visualize, troubleshoot, and alert on your AWS Lambda functions with New Relic Serverless.