If you’re responsible for building and maintaining distributed cloud native applications built on containers, microservices, or serverless functions, you know how hard it can be to track down errors and pinpoint latency. And when it comes to resolving production issues that impact your customers, every second counts. But finding issues in a distributed system is easier said than done; here’s why:
- Distributed tracing tools are hard to configure, use, and scale
- Issues can be missed if you’re not observing 100% of application traces
- Autonomous teams build and maintain the services they own (you build it, you own it)
- Frequent changes impact upstream and downstream services (CI/CD, software API contract changes, etc.)
- Dependencies on third-party APIs and applications
- Latency in one service might be a symptom of errors in another service
Additionally, legacy distributed tracing tools use random head-based sampling. That means application errors and unusual latency could be missed if the suspect trace isn’t sampled, making it even harder to solve problems.
If any of those issues sound familiar, don’t worry—you’re not alone. That’s why we’ve put a ton of hard work into building a fully managed, tail-based distributed tracing solution that observes 100% of application traces and takes the heavy lifting out of resolving these kinds of issues. We call it New Relic Edge with Infinite Tracing, and today we’re excited to announce that New Relic users with a Pro or Enterprise Full-Stack Observability account can access and benefit from New Relic Edge.
Why New Relic Edge
When we initially released New Relic Edge back in May of this year to a limited set of customers, we knew it would help them solve some of their toughest challenges. Here’s how:
- It’s simple: No more headaches configuring a complex tracing solution. Just install the agent or use open instrumentation, point the spans at New Relic, and boom! It’s done.
- It saves time and money: New Relic Edge is a fully-managed, multi-tenant service with unparalleled, on-demand scalability. That means you can eliminate the cost and toil associated with deploying, managing, and scaling third-party tracing infrastructure.
- It solves hard-to-find issues: New Relic Edge is a tail-based distributed tracing solution that observes 100% of spans and visualizes the most actionable data so you can resolve issues faster. New Relic Edge helps you pinpoint and resolve hard to find issues across your entire distributed system.
“New Relic Edge with Infinite Tracing helps us pinpoint the spans involved in problematic transactions, or even healthy transactions, to see at a glance what services are involved.”
— Staci M., Cloud Site Reliability Manager, Vodori
Expanded availability, functionality
With our GA announcement today, we’re also excited to share that you can benefit from several new updates to New Relic Edge that are available immediately:
- New Cloud Regions and EMEA availability: In addition to the AWS us-east-1 region, New Relic Edge is now available in AWS us-west-1 and eu-west-1. Note that you can send spans to New Relic Edge from wherever your workloads are running, including on-premises. The regions listed above are where New Relic hosts and manages the trace observer endpoints. If your workload is not in one of those regions, you’ll just want to take any bandwidth and data ingress/egress implications into consideration.
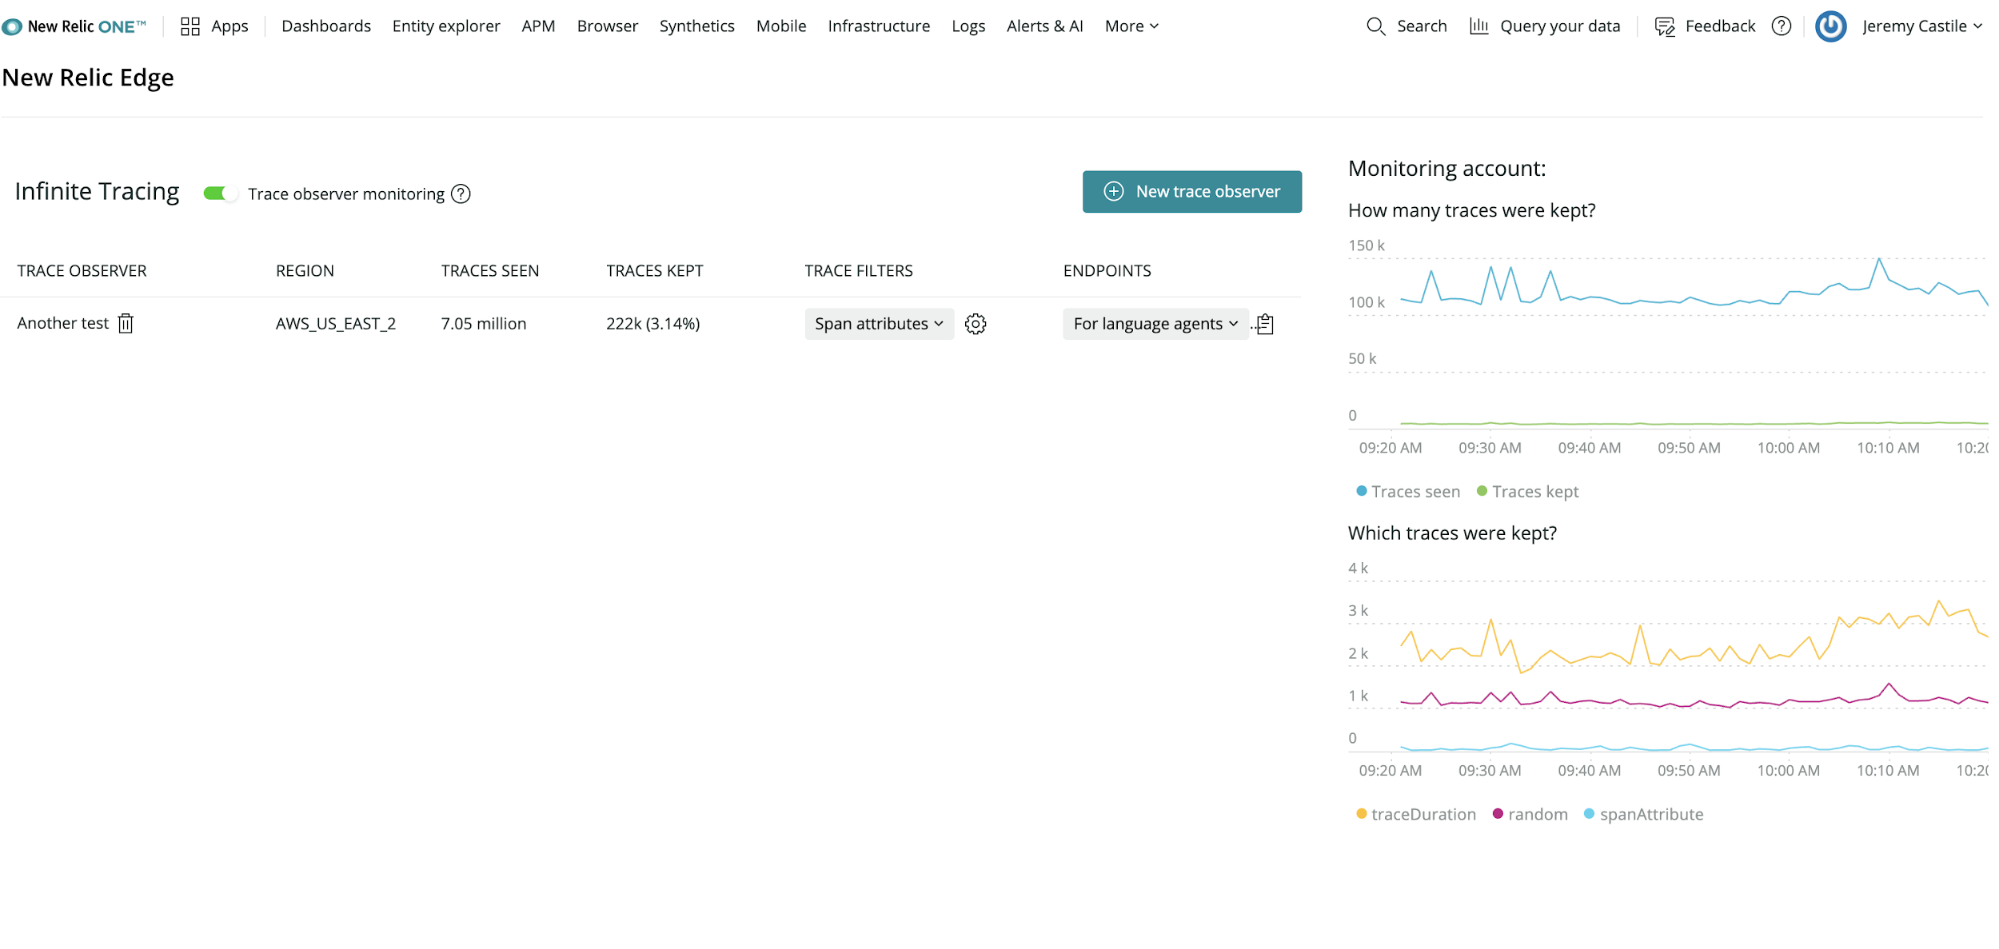
- New Relic Edge app: We’ve made setting up New Relic Edge even easier with a new app. Now you can configure a trace observer, set up your custom filtering logic and monitor your trace observer metrics all in one place.
 To use the New Relic Edge app:
- Click on Apps from the menu at the top of the New Relic One homepage:

- Navigate down the page to the New Relic Edge app, and click on the tile. Note the apps are in alphabetical order. Make sure to click the star icon to favorite the app, which will make it super easy to find going forward.

- Click on Apps from the menu at the top of the New Relic One homepage:
- Custom Trace Filtering: You can now customize trace filtering rules to keep or discard traces with specific attributes, giving you the ability to tell New Relic Edge which traces you care about the most. You can use the New Relic Edge app to view and define trace filtering rules using key/value pairs. For example, suppose you wanted to add a rule to keep all spans with attributes containing the user
sally@some_company.com. You can simply define the rule using the app and all traces matching the rule will be kept:
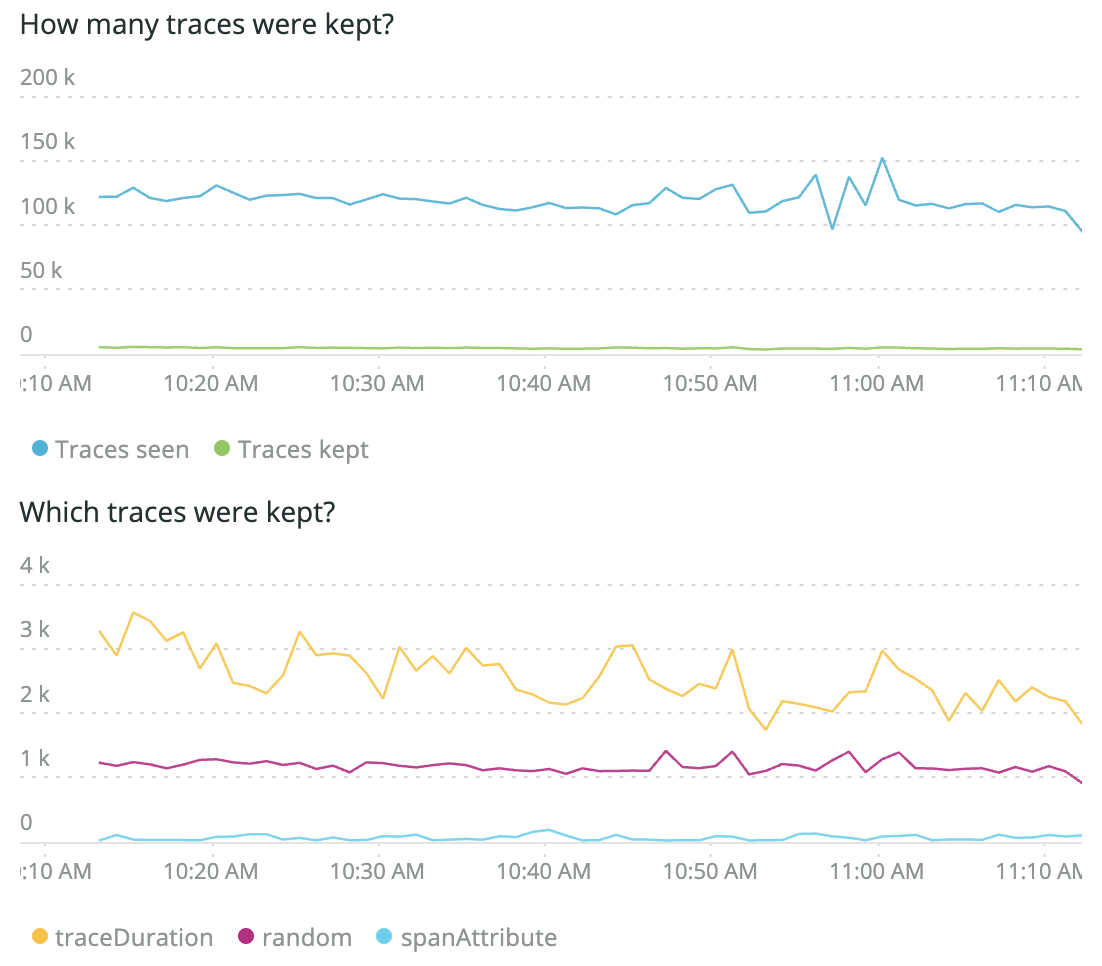
- Trace Observer Monitoring: From the New Relic Edge app, you can now monitor trace observer metrics. The two charts show the amount of traces seen and kept by the trace observer, and which category of traces were kept. This can be a useful tool to see if New Relic is processing your traces as you expect:

Infinite Tracing superpower
With some customers sending 50-100 million spans per minute to New Relic Edge, we’re confident that it can meet any environment’s scaling needs. When you use New Relic Edge, you really do get an Infinite Tracing superpower.
New Relic Edge is available for all Full-Stack Observability customers with Pro or Enterprise accounts. Learn more and get started with New Relic Edge today.
The views expressed on this blog are those of the author and do not necessarily reflect the views of New Relic. Any solutions offered by the author are environment-specific and not part of the commercial solutions or support offered by New Relic. Please join us exclusively at the Explorers Hub (discuss.newrelic.com) for questions and support related to this blog post. This blog may contain links to content on third-party sites. By providing such links, New Relic does not adopt, guarantee, approve or endorse the information, views or products available on such sites.


