What's included?
dashboards
1
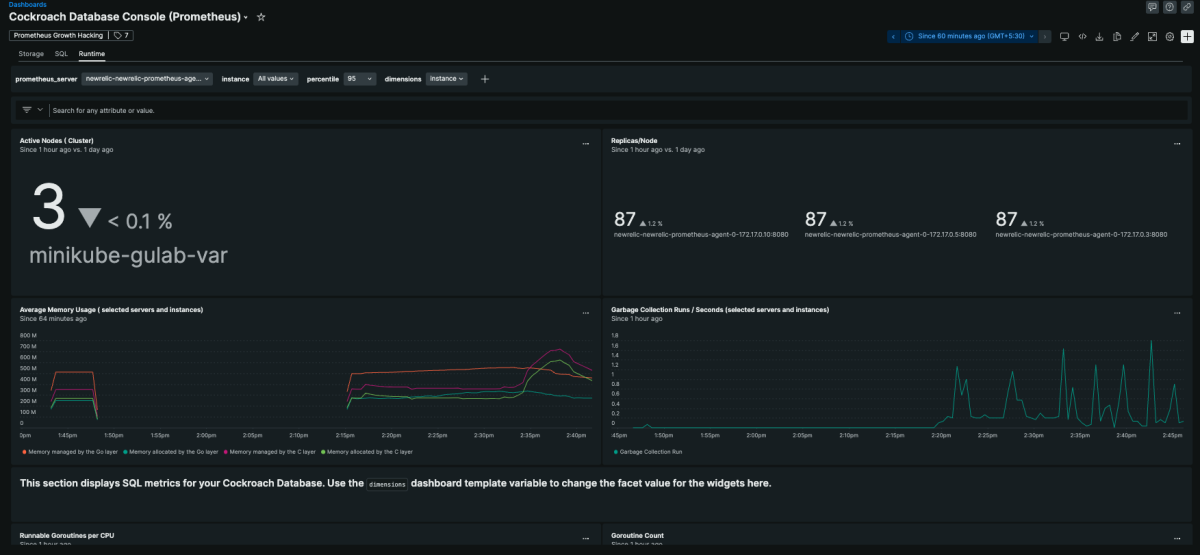
CockroachDB (Prometheus) quickstart contains 1 dashboard. These interactive visualizations let you easily explore your data, understand context, and resolve problems faster.
CockroachDB (Prometheus)
alerts
13
CockroachDB (Prometheus) observability quickstart contains 13 alerts. These alerts detect changes in key performance metrics. Integrate these alerts with your favorite tools (like Slack, PagerDuty, etc.) and New Relic will let you know when something needs your attention.
UI certificate expiration
This alert is triggered when there are less than 30 days remaining for UI certificate expiration. The alert threshold can be changed to your desired expiration alerting requirements.
Node down alert
This alert triggers when a node is down for 15 minutes. The alert threshold can be changed to your acceptable downtime requirements.
Instance dead alert
This alert triggers when an instance is down for 15 minutes. The alert threshold can be changed to your acceptable downtime requirements.
Slow latch requests
This alert triggers when there are > 0 slow latch requests for over 5 minutes. The alert threshold can be changed to your acceptable slow request requirements.
Low disk storage
Send an alert when available storage capacity is below 15% for over 15 minutes. The alert threshold can be changed to your desired storage limit requirements.
UI CA certificate expiration
This alert is triggered when there are less than 90 days remaining for UI CA certificate expiration. The alert threshold can be changed to your desired expiration alerting requirements.
Client CA certificate expiration
This alert is triggered when there are less than 90 days remaining for Client CA certificate expiration. The alert threshold can be changed to your desired expiration alerting requirements.
High fd open count
This alert is triggered when a node passes 80% of the open file descriptors limit for 15 minutes. The alert threshold can be changes to your desired file descriptors limit requirements.
Node certificate expiration
This alert is triggered when there are less than 30 days remaining for Node certificate expiration. The alert threshold can be changed to your desired expiration alerting requirements.
Slow raft requests
This alert triggers when there are > 0 slow raft requests for over 5 minutes. The alert threshold can be changed to your acceptable slow request requirements.
Slow lease requests
This alert triggers when there are > 0 slow lease requests for over 5 minutes. The alert threshold can be changed to your acceptable slow request requirements.
CA certificate expiration
This alert is triggered when there are less than 90 days remaining for CA certificate expiration. The alert threshold can be changed to your desired expiration alerting requirements.
Cluster running with different versions
This alert is triggered when there are multiple versions of CockroachDB running in a single cluster.
documentation
2
CockroachDB (Prometheus) observability quickstart contains 2 documentation reference. This is how you'll get your data into New Relic.
Cockroach Database CockroachDB is a distributed SQL database built on a transactional and strongly-consistent key-value store. It scales horizontally; survives disk, machine, rack, and even datacenter failures with minimal latency disruption and no manual intervention; supports strongly-consistent ACID transactions; and provides a familiar SQL API for structuring, manipulating, and querying data.
Install this quickstart to access preconfigured CockroachDB observability solutions based on Prometheus metrics that are available out-of-the-box.


