What's included?
dashboards
1
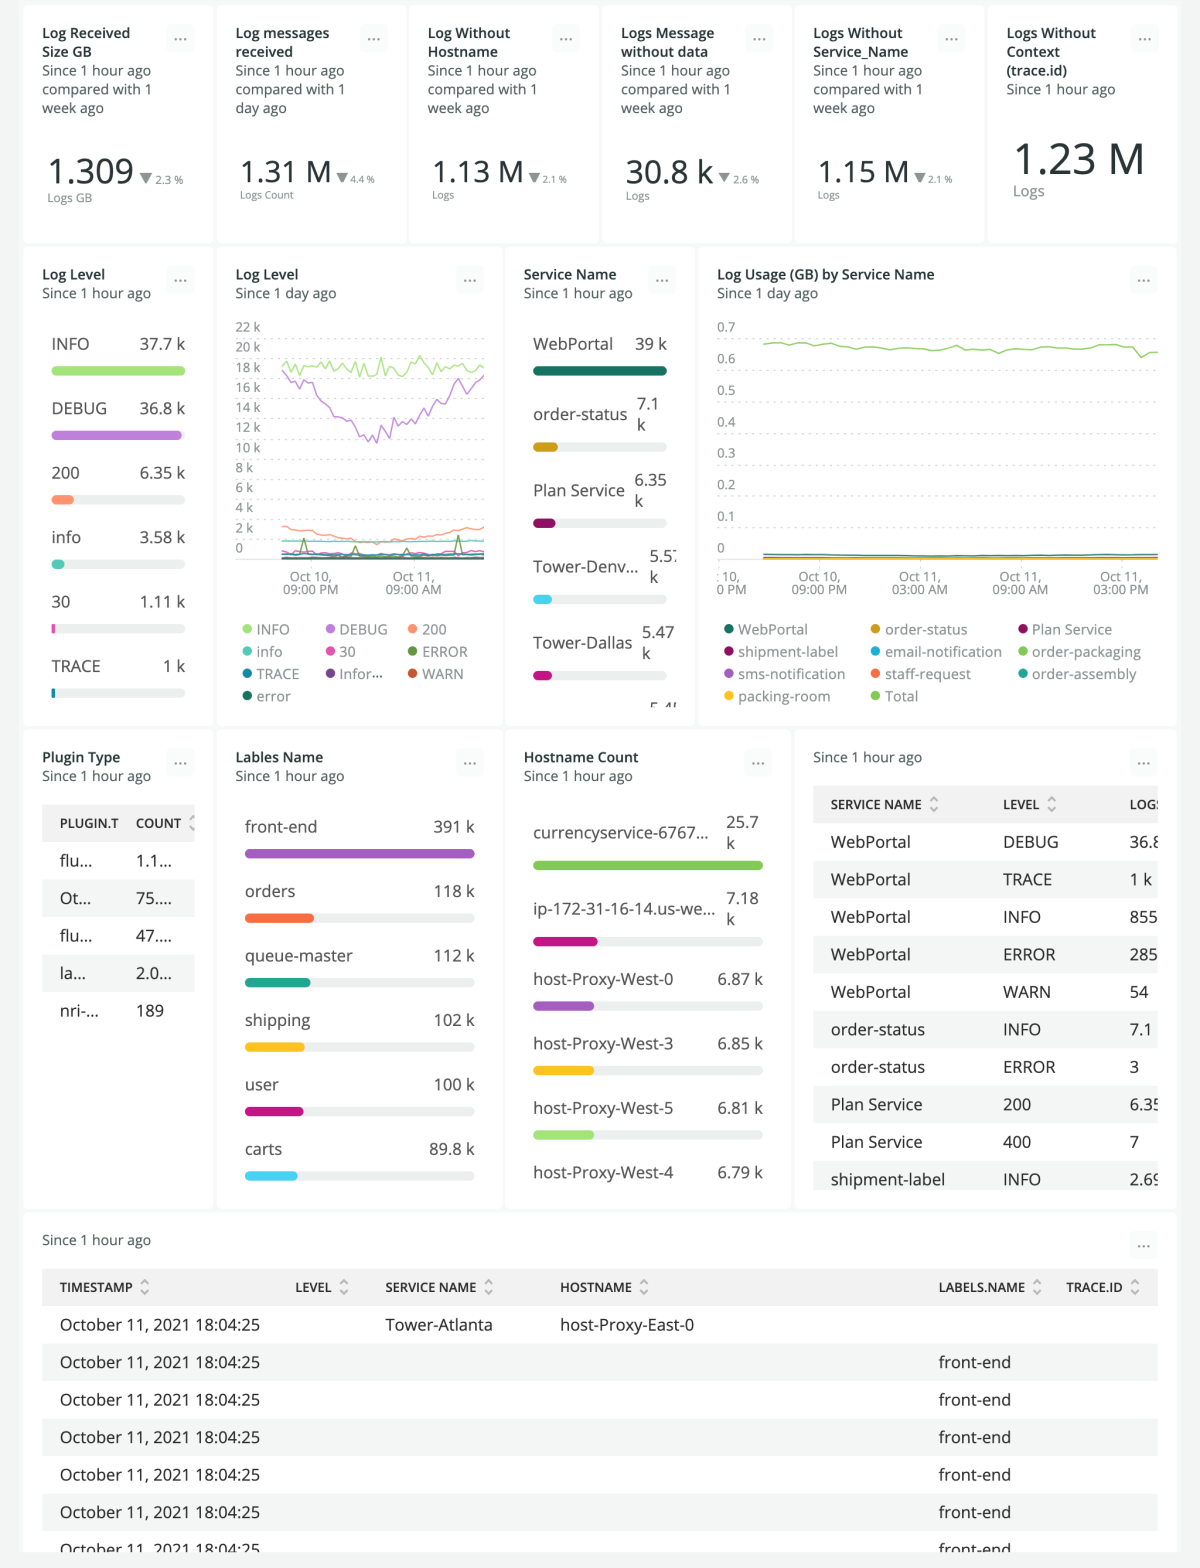
Logs Analysis Dashboard quickstart contains 1 dashboard. These interactive visualizations let you easily explore your data, understand context, and resolve problems faster.
Logs Analysis
documentation
1
Logs Analysis Dashboard observability quickstart contains 1 documentation reference. This is how you'll get your data into New Relic.
alerts
0
This quickstart doesn't include any alerts. Do you think it should?
You can edit this quickstart to add helpful components. View the repository and open a pull request.
You can edit this quickstart to add helpful components. View the repository and open a pull request.
View repo
View repo
The logs analysis dashboard allows you to get deep visibility into the ingestion of your logs. With this panel, you will be able to identify the services and host that send the most logs, which types of serverity are being sent, the cost for each of the attributes and also if the essential attributes are being sent for the ccorrelation between services and logs, such as: service name, log in context and hostname.

