What's included?
You can edit this quickstart to add helpful components. View the repository and open a pull request.
What is Azure Event Grid Domains?
Event Grid Domains within the Event Grid service is a management capability to manage a large number of events.
New Relic Azure Event Grid Domains quickstart features
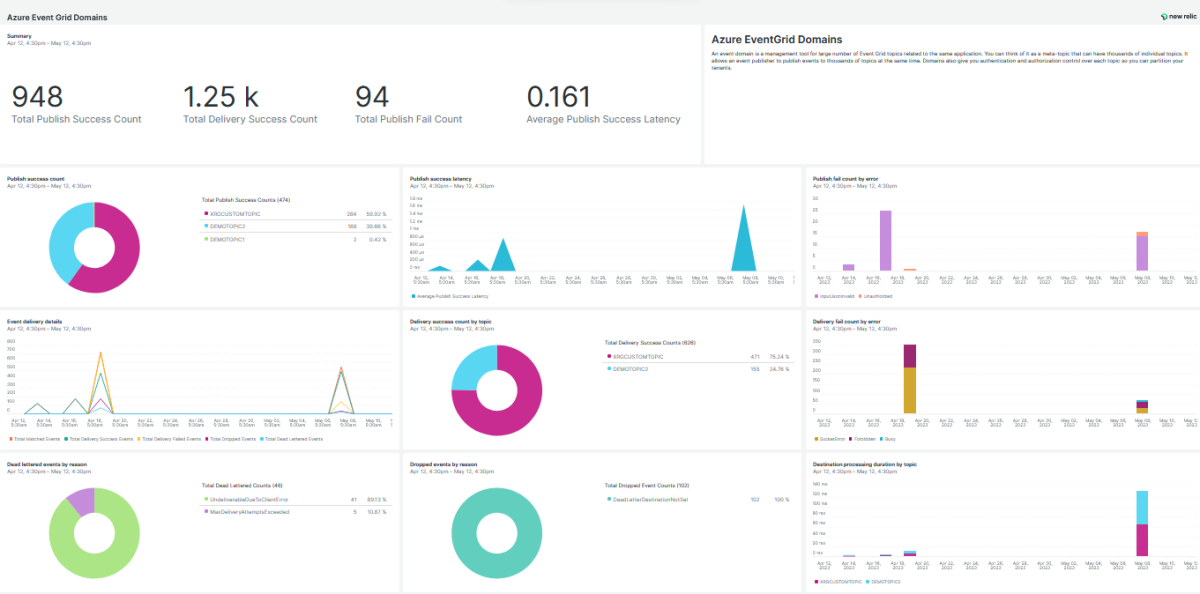
A standard dashboard that tracks key indicators like dead lettered count, delivered events, dropped events and matched events. It runs custom queries and visualizes the data immediately.
Why monitor Azure Event Grid Domains with New Relic?
New Relic Azure Event Grid domains monitoring quickstart empowers you to track the performance of Azure Event Grid Domains via different metrics including dead lettered count, delivered events, dropped events and matched events.
Our integration features a standard dashboard that provides interactive visualizations to explore your data, understand context and get valuable insights.
Start ingesting your Azure data today and get immediate access to our visualization dashboards so you can optimize your Azure service.


