現在、このページは英語版のみです。

PHP

New Relic's instant observability quickstart with a PHP server monitor agent helps app developers quickly identify and resolve errors, including slow responses, to enhance customer experiences.

What's included?

dashboards
1
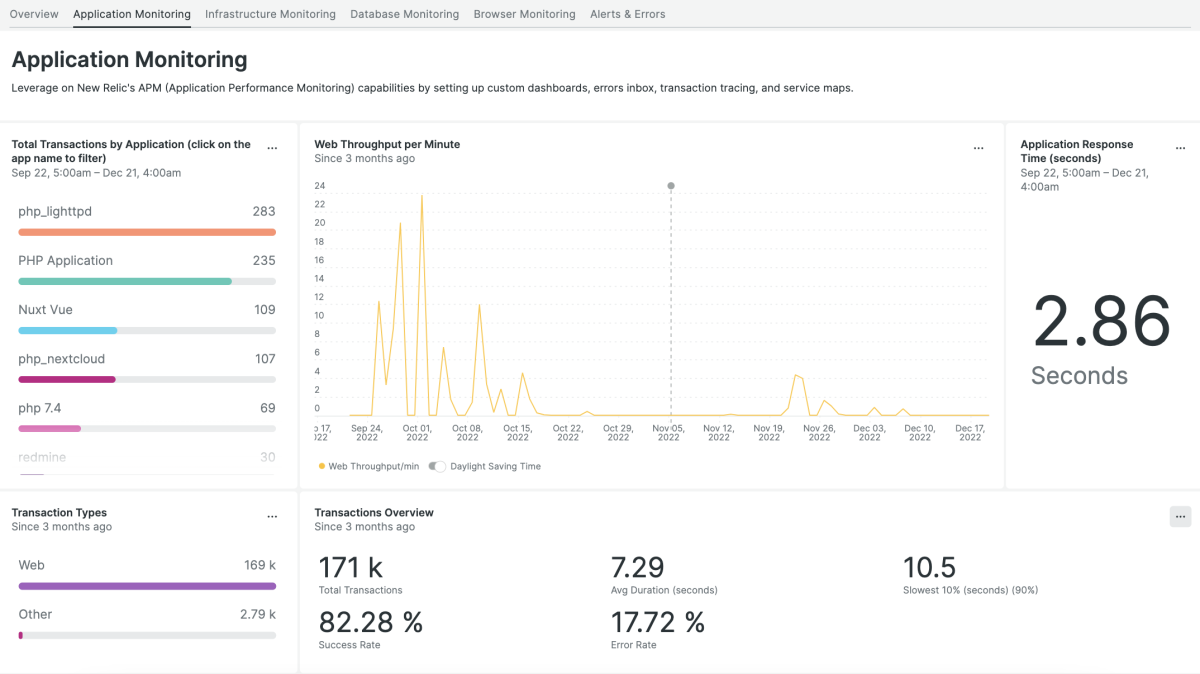
PHP quickstart contains 1 dashboard. These interactive visualizations let you easily explore your data, understand context, and resolve problems faster.
alerts
3
PHP observability quickstart contains 3 alerts. These alerts detect changes in key performance metrics. Integrate these alerts with your favorite tools (like Slack, PagerDuty, etc.) and New Relic will let you know when something needs your attention.
Low throughput
This alert is triggered when the throughput is 0 for 5 minutes
High error rate
This alert is triggered when the error percentage of web transactions is higher than 5% during 5 minutes
High duration
This alert is triggered when the total duration of the web transaction is longer than 10 seconds during 5 minutes
documentation
1
PHP observability quickstart contains 1 documentation reference. This is how you'll get your data into New Relic.

PHP server monitoring

Use our PHP monitoring agent to see a high-level summary of their app performance in a comprehensive PHP dashboard. Help teams monitor the app's Apdex, build architectural maps, and find and resolve errors quickly.

Our PHP agent collects and analyzes application data that drive data-driven decisions. Organize data, query data using NRQL, and visualize data (in customizable interactive dashboards) that directly impact customer experiences.

Real-time PHP metric monitoring

Identify slow AJAX request performance issues at a glance through our PHP dashboard that boasts broader visibility. Proactively monitor where you should concentrate your efforts and address potential errors quickly.

What’s included?

Our PHP quickstart include out-of-the-box dashboards and alerts, including:

  • Alerts including error rates, duration, and throughput
  • Multiple ready-to-use dashboards including throughput, error rate percentage, transaction time in milliseconds, and latest transactions

Discover the value of our PHP quickstart

New Relic's instant observability quickstart helps developers leverage broader visibility in a PHP dashboard to resolve errors and speed up processes that enhance customer experiences.

How to use this quickstart

  • Sign Up for a free New Relic account or Log In to your existing account.
  • Click the install button.
  • Install the quickstart to get started or improve how you monitor your environment. They're filled with pre-built resources like dashboards, instrumentation, and alerts.
Authors
New Relic
Support
BUILT BY NEW RELIC
Need help? Visit our Support Center or check out our community forum, the Explorers Hub.