What's included?
dashboards
1
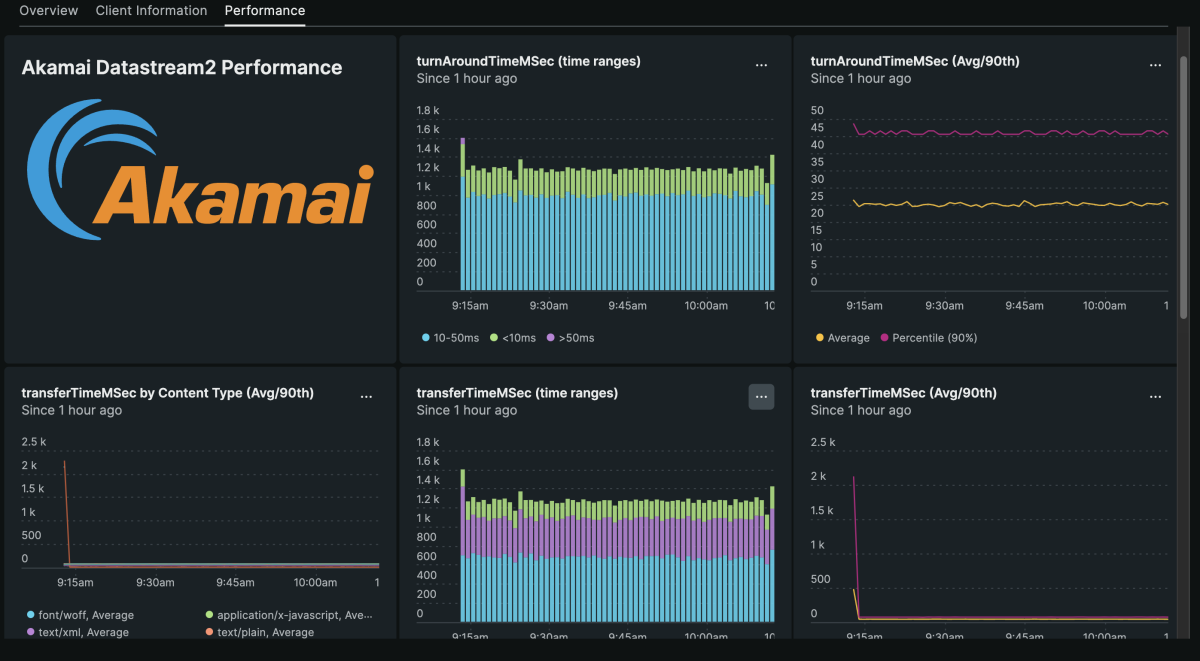
Akamai DataStream 2 quickstart contains 1 dashboard. These interactive visualizations let you easily explore your data, understand context, and resolve problems faster.
Akamai DataStream 2
alerts
1
Akamai DataStream 2 observability quickstart contains 1 alert. These alerts detect changes in key performance metrics. Integrate these alerts with your favorite tools (like Slack, PagerDuty, etc.) and New Relic will let you know when something needs your attention.
DataStream 2 - 5xx error greater than 1%
Alert triggered when the error rate(5xx errors) exceeds 1%
documentation
1
Akamai DataStream 2 observability quickstart contains 1 documentation reference. This is how you'll get your data into New Relic.
Akamai and DataStream 2
Akamai Technologies is a leading content delivery network (CDN), cybersecurity, and cloud service provider.
DataStream 2 captures performance and security logs from your delivery properties and streams them in near real-time to provide complete monitoring.
About this integration
This integration utilizes the data captured and and stream via DataStream 2 to visualize and monitor your CDN performance and security logs in real time. Included with the data
- HTTP status code distribution
- Error rate
- Log ingest
- Cache hit ratio
- TLS overhead time ranges
- Overhead byte ranges
- HTTP protocol distribution


