What's included?
Why monitor Episerver CMS?
Episerver offers a web content management system (CMS), digital marketing, and digital commerce services via its Episerver Digital Experience Platform Cloud Service. New Relic quickstart instruments Episerver CMS with the New Relic .NET agent to instantly monitor Episerver CMS with best-in-class dashboards and alerts.
Episerver CMS quickstart highlights
The New Relic Episerver CMS quickstart has the following features:
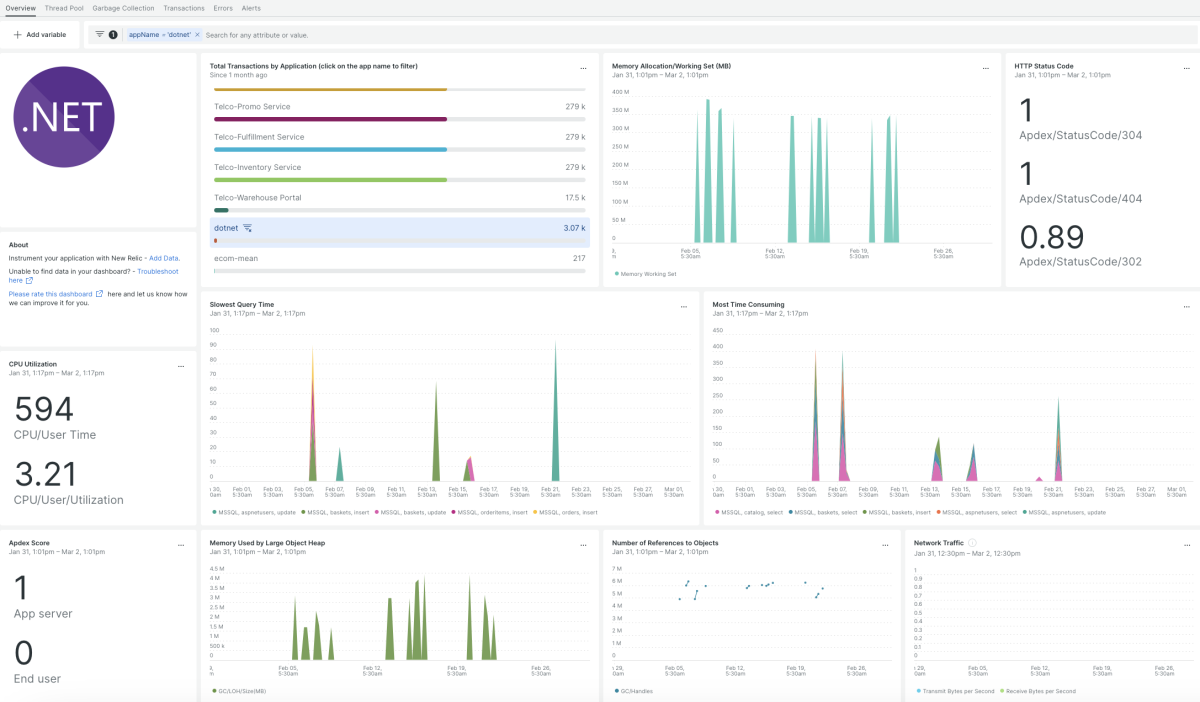
- Dashboards: Our dashboards provide you a clear overview of transactions, errors, and the virtual machine. The dashboards also help you monitor other key indicators like top 10 failed transactions, latest errors, and more.
- Alerts: You can get instant alerts on performance metrics like Apdex score, memory usage, and transaction errors.
Our .NET agent supports both .NET Framework and .NET Core, and works with all .NET compatible languages. In addition to the .NET agent, you can also install New Relic’s infrastructure monitoring agent to view the performance of Episerver’s host environment.
New Relic + Episerver CMS = Optimum performance monitoring
Monitor your Episerver CMS performance with our .NET agent. The integration provides a high-level overview of Episerver CMS, giving you access to code-level details like transaction traces, database queries, and errors. Also, it empowers you to track activities across a large Episerver distributed system. New Relic Episerver CMS quickstart gives you proactive notifications from alerts to respond quickly when your app stops running seamlessly. You can use the query builder to create custom dashboards from your data. Download New Relic Episerver CMS quickstart today to monitor Episerver CMS metrics in real-time. This quickstart is your gateway to instant monitoring of your Episerver CMS.

