What's included?
dashboards
1
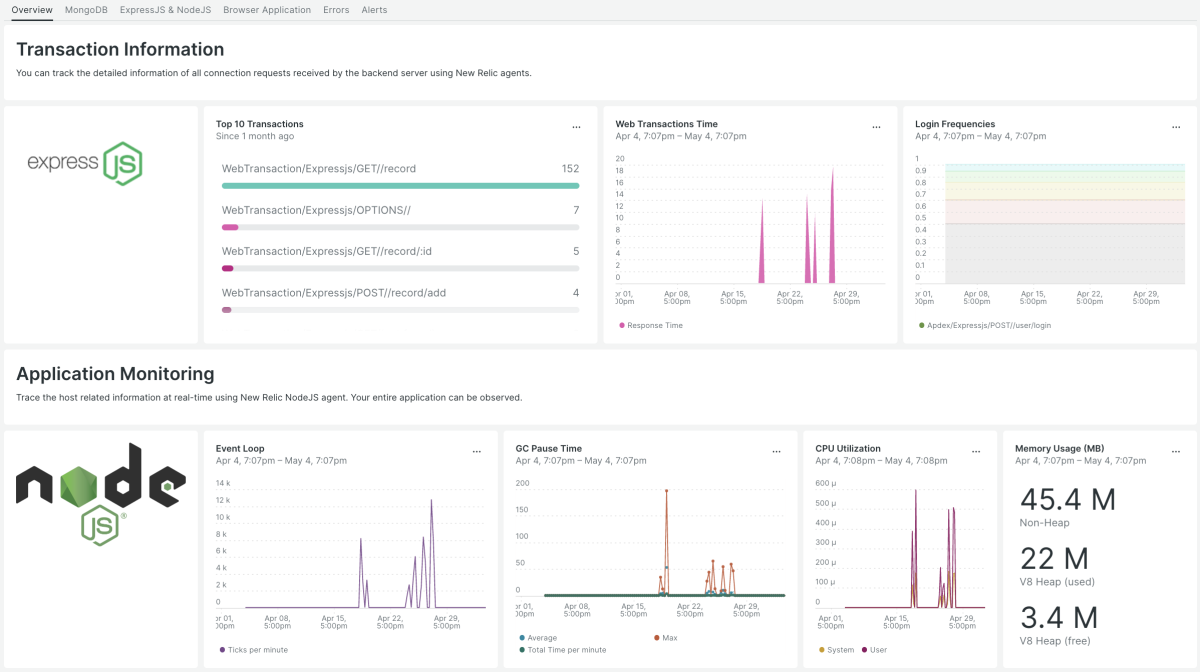
MERN Stack quickstart contains 1 dashboard. These interactive visualizations let you easily explore your data, understand context, and resolve problems faster.
MExN
alerts
4
MERN Stack observability quickstart contains 4 alerts. These alerts detect changes in key performance metrics. Integrate these alerts with your favorite tools (like Slack, PagerDuty, etc.) and New Relic will let you know when something needs your attention.
Transaction Errors
This alert is triggered when 1 or more transactions fail for 5 minutes.
First Contentful Paint
This alert is triggered when the first contentful paint exceeds 2 seconds for 5 minutes.
Free Memory (%)
This alert is triggered when the server memory is less than 20% for 5 minutes.
MongoDB Up
This alert is triggered when the MongoDB is down for 3 minutes.
documentation
1
MERN Stack observability quickstart contains 1 documentation reference. This is how you'll get your data into New Relic.
Comprehensive MERN Stack Monitoring System
MERN Stack is a widely used open-source framework that is based on JavaScript and is used to create dynamic web pages and online applications. The framework comprises of four components, namely MongoDB, ExpressJS, ReactJS, and NodeJS, all of which play a vital role in the development of web applications. These four technologies integrate seamlessly and logically, making it easy to build web applications using the MERN Stack. Each of these components is based on JavaScript and JSON, which makes the integration process simpler and more efficient.
What should you look for in a MERN dashboard?
- MongoDB metrics such as active connections, database details, and usage time
- For ExpressJS and NodeJS, there are a variety of metrics available, including web transactions, top ten errors, and memory usage
- ReactJS metrics include page views by city, ajax requests, and viewed urls. Additionally, you can create your own chart based on the metrics collected
What’s included in the MERN quickstart?
Install this quickstart to setup preconfigured observability solutions:
- A number of high-value alerts are available including the average number of connections created, the FCP score and the memory usage
- Informative dashboards (the top 10 transactions, connections, database indexes, and more)


