What's included?
dashboards
1
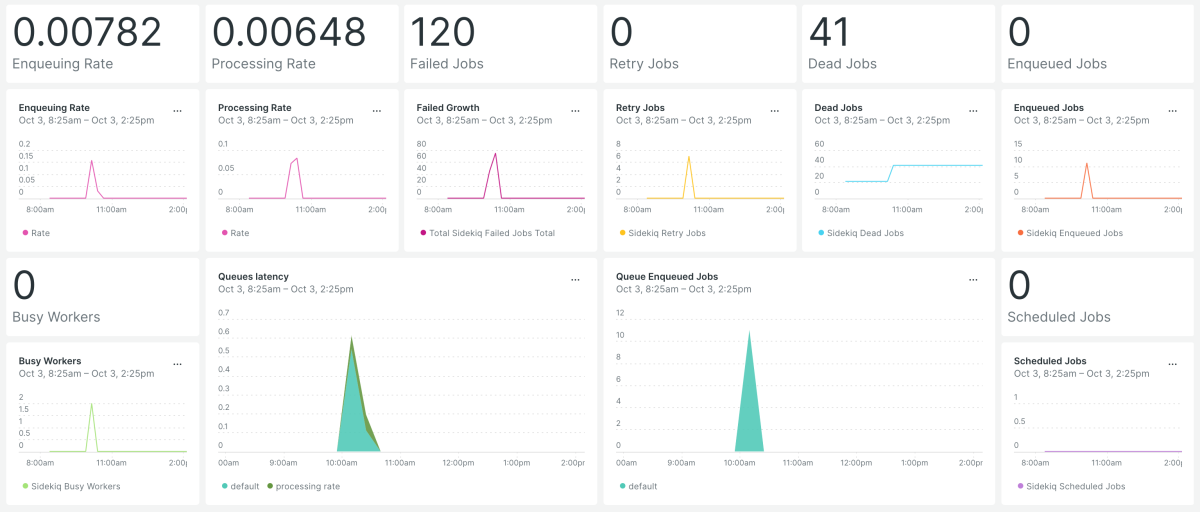
Sidekiq Prometheus quickstart contains 1 dashboard. These interactive visualizations let you easily explore your data, understand context, and resolve problems faster.
Sidekiq-Prometheus
documentation
2
Sidekiq Prometheus observability quickstart contains 2 documentation reference. This is how you'll get your data into New Relic.
alerts
0
This quickstart doesn't include any alerts. Do you think it should?
You can edit this quickstart to add helpful components. View the repository and open a pull request.
You can edit this quickstart to add helpful components. View the repository and open a pull request.
View repo
View repo
Use this quickstart to monitor your Sidekiq Prometheus metrics. It uses a third-party Sidekiq Prometheus Exporter that exposes a '/metrics' endpoint which is then scraped by the New Relic Prometheus Agent.

