New Relic Now Start training on Intelligent Observability February 25th.
Save your seat.
現在、このページは英語版のみです。
 / 
Tomcat

Tomcat

Monitoring Tomcat is critical to track its performance via key metrics like transaction errors, memory usage, and CPU utilization. Download our Tomcat instant observability quickstart to instrument Tomcat with our Java agent.

What's included?

dashboards
1
Tomcat quickstart contains 1 dashboard. These interactive visualizations let you easily explore your data, understand context, and resolve problems faster.
alerts
2
Tomcat observability quickstart contains 2 alerts. These alerts detect changes in key performance metrics. Integrate these alerts with your favorite tools (like Slack, PagerDuty, etc.) and New Relic will let you know when something needs your attention.
Transaction Errors
This alert is triggered when the the transactions fail more than 10% of the time in 5 minutes.
High CPU Utilization
This alert is triggered when the CPU Utilization is above 90%.
documentation
1
Tomcat observability quickstart contains 1 documentation reference. This is how you'll get your data into New Relic.
What is Tomcat?

Open-source implementation of the Java Servlet, JavaServer Pages, Java Expression Language and WebSocket technologies.It implements Java enterprise specs like WebSocket technologies and JavaServer Pages. The Apache Tomcat software powers large-scale, mission-critical web applications across a diverse range of organizations.

New Relic Tomcat quickstart features

Our Tomcat monitoring integration has the following features:

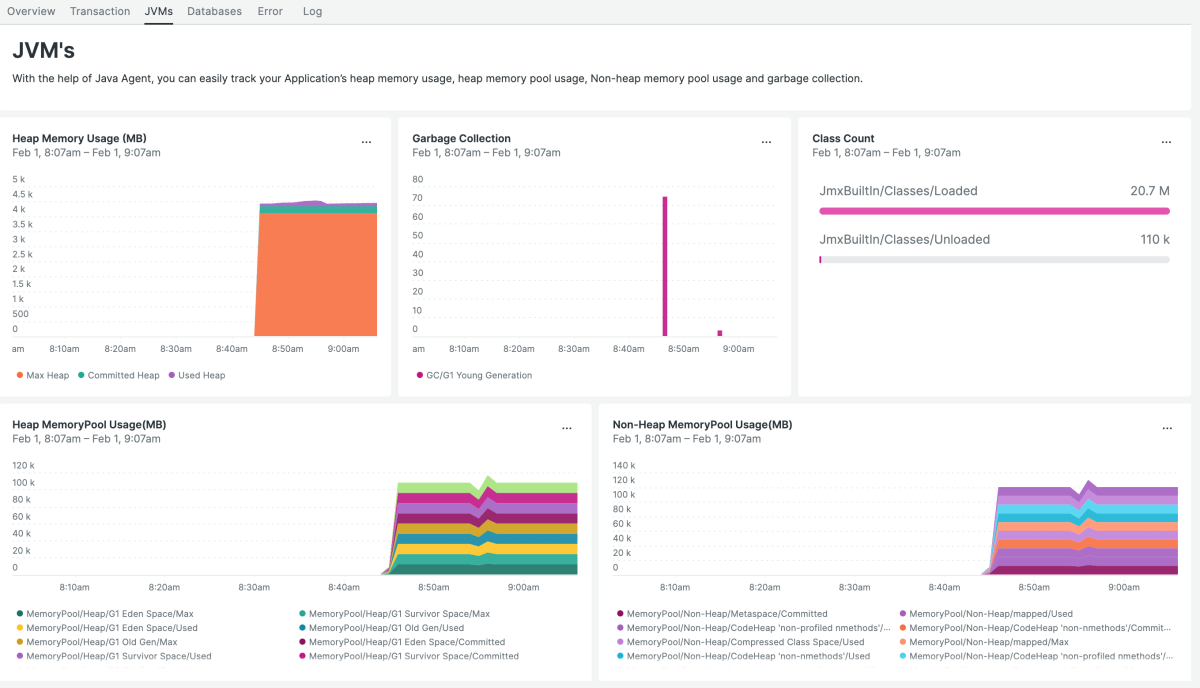
  • A standard dashboard that tracks key indicators like error overview, virtual machine overview, daily transaction errors, transaction errors today vs 1 week ago, CPU utilization, memory heap used, and more
  • Instant alerts on performance metrics like transaction errors and high CPU utilization
  • Custom queries and immediate data visualization

Why monitor Tomcat with New Relic?

New Relic’s Tomcat monitoring quickstart automatically instruments Tomcat with the New Relic Java agent. It helps you to immediately monitor Tomcat’s memory usage and other indicators with instant alerts and a standard dashboard, giving you valuable insights to improve Tomcat’s performance.

Our Tomcat integration empowers teams to monitor micros-services under Tomcat. Your team can leverage the integration to report all data for each service to New Relic and drill into specific JVMs to see the data and details for each instance.

Get started with New Relic Tomcat monitoring quickstart today to proactively monitor Tomcat.

How to use this quickstart

  • Sign Up for a free New Relic account or Log In to your existing account.
  • Click the install button.
  • Install the quickstart to get started or improve how you monitor your environment. They're filled with pre-built resources like dashboards, instrumentation, and alerts.